Browsed by
Author: Rishi Singh - Founder

Matisse and Memory – What Matisse Means for Traders

Matisse and Memory – What Matisse Means for Traders

I was going through old E-mails when I came across a correspondence I wrote to some friends awhile ago. Those of you reading this may be wondering, “what does Matisse have to do with trading?”

Let me explain.

Investors and traders are creatives. Experienced market players will acknowledge this, but to those who are just breaking in you may not realize it. After all, finance is fraught with imagery of old men in suits, but if you were to stop any long-time trader in a hedge fund, you would find varied interests and a more holistic view of life.

Why is that?

A trader or investor’s job is to find ideas the rest of the world hasn’t. By that very nature, they have to be creative and you see prominent trading psychologists, like Brett Steenbarger, who help traders with idea generation.

A second important fact of traders is the concept that we must focus on process vs. outcome. This is something I learned from Brett, and you can find a great PDF read on the topic here: Process vs. Outcome in Sports, Business, and Economics

The top traders in the world may only be right 55-60% of the time. If we were to try and keep track of that in our heads, it would probably feel no different than a coin flip. Actually, it would feel far worse because our psychological biases make us assign a higher probability to events that are stronger in memory. You can see this with the number of people who may buy insurance after an outlier event like a hurricane that may not happen frequently. Even if the odds of a same hurricane of that magnitude are exactly the same, people will assign a higher liklihood of that happening because it is stronger in memory.

A great book, which we will get to in a moment with Matisse, that goes into our psychological biases with data analysis was made public domain by the CIA. The founder of the former fund I used to trade at called it one of the best books he ever read on markets: Psychology of Intelligence Analysis

And the final thing touched upon in the E-mail that relates to markets is: how much information is too much information? Those of you may have heard of Nate Silver, who writes the 538 Blog. Another person who has been in this realm for a long time is Philip Tetlock who specializes in forecasting. His most recent book is out (haven’t read it yet, but his previous one was fanstic) which is getting rave reviews: Superforecasting: The Art and Science of Prediction

Basically he has found that experts suck at prediction, and sometimes too much information actually leads to worse prediction. This is something. Psych. of Intel. Analysis touches upon as well.

So with that preface, I will copy and paste the E-mail I wrote below. Enjoy 🙂


I thought back to our conversation over the weekend about Matisse. I wanted to crystallize what it was about him that I most enjoyed. Here are some thoughts from my notebook:

Matisse was a man who followed the process and didn’t necessarily seem to view the process as a struggle but as a means to achieving the product he wanted. He would attempt to reduce items to their most simple form and reduce complexity and detail to evoke the same emotional arousal. He worked iteratively and hired a photographer to document his process once the technology was there. It becomes apparent that his work started with many details and much complexity, and the later revisions would come back to capture the essence. His first successful attempt at this was in Young Sailor I and II.

Young Sailor I and II

Young Sailor I and II have to have been my most favorite pieces I have seen of Matisse to date. I think part of it is how he captured the very essence and process of memory storage:
Sensory Image Storage -> Short-term memory -> Long-term memory (recap https://www.cia.gov/library/center-for-the-study-of-intelligence/csi-publications/books-and-monographs/psychology-of-intelligence-analysis/PsychofIntelNew.pdf on page 18-19). I haven’t found commentary yet that makes note of this. What is so Matisse about this is that he captures the process of memory storage, while trying to actually evoke memory and feeling! He started documenting the process before he knew he was documenting a process about recreating an emotion. It’s so meta and hipster – he belongs in williamsburg.

Young Sailor I contains all the fine details of an actual image of a young sailor that looks a lil’ bit angsty. The second iteration he comes back to his mental image of the the young sailor… but this time he is a little boyish figure with a big smile and child-like features (Young Sailor II). The difference in brush strokes subconsciously makes clear the Young Sailor II is a mental image and also lighter and softer in features. A common experience was how the 6th graders looked so large as a 3rd grader; but, looking back I realize how little they were themselves. To any parent, even the meanest 6th grader was an angel.

It was the process of Sailor I and II and the idea of capturing an essence rather than all the fine details that sticks to me about this painting. These ideas also travel over into statistics and psychological biases where it’s been shown added information can only help predictive edge so a certain degree before it actually hurts. Sometimes knowing less about a topic lets you make a more correct decision (reading Tetlock right now about this …another source is  Psychology of Intelligence Analysis).

And to add on top of all of this…Matisse was embarrassed of Young Sailor II and originally told everyone that someone else did it to avoid embarrassment. Young Matisse was human. Even he didn’t think it would be received well.

Best,

Rishi


Facebooktwitterredditpinterestlinkedinmail
Launching the Tiingo Open Data Initiative

Launching the Tiingo Open Data Initiative

Since day one, Tiingo has been committed to providing you with top quality data that is more accurate than companies charging $30k+ a year.

How in the world is a company with a “set your own price” model going to pull this off?

Because we’re going to do something unheard of.

Presenting the Tiingo Open Data Initiative

Sound sexy?

No? Good, because clean data should be boring. Except we’re still going to try and make it sexy (we like doing the impossible).

aapl div


We’ve all been there, looking at a number on a financial tool and wondering, “is that number actually right?” Then we might go to another website or source and double check. Even if we see two equal numbers, we think, “hmm… ok.”

And our skepticism is well-warranted. Often there will be 1 or 2 main vendors for the same source of data. If one vendor is wrong, then many financial sites are wrong.

So what if a company could show you where, when, and how they got their numbers? This is what our Open Data Initiative is about: transparency.

Now within less than a second, you can verify Tiingo’s numbers straight from the official source: press releases. Either hover your mouse over the orange binoculars or click the “Source” link directly to see where, when, and how we got our data.

Try it here:
AAPL Dividend History

Cool huh?

Dividends are just the start.

BUT WAIT THERE’S MORE!
Since the ethos of Tiingo is to “Actively Do Good,” when we are ready we will open all of this data to the world via an API. Right now when we catch mistakes, we are notifying our data vendor so they can fix the data for all their users. We don’t believe in holding good data hostage.

A quick aside: back-populating dividend data and sourcing it is a data intensive process but we are working around the clock to load in this data historically. However, future dividends are being monitored and added in real-time.

From Tiingo with Love

-Rishi


Facebooktwitterredditpinterestlinkedinmail
Screening for Increasing Dividends

Screening for Increasing Dividends

A user asked us if we could allow screening for increasing dividends; but, we figured we’d do one better. What if you could screen for the increases and decreases of any metric? Tiingo now allows this in 3 easy steps.

Step 1: Create a custom metric

To start, visit the custom metrics page here: https://www.tiingo.com/screen/custom

Simply enter the metric you want in the “formula” box. In this example we want to see if the dividend increases, so we type:

“Dividend_Cash”

divcash_premetrictype

But we want to see how many times the cash dividend has increased, so we follow it up with a “.” and use our new metric “.countincr(#)”

The # in this case represents the last # of dividends. Since most dividend stocks pay out quarterly, to see how many times the dividends increased in the past year, we would type in “4” for the #.

Our final formula looks like:

divcashformula

Step 2: Create the Screen

Click “Create Metric” and visit the screening page here: https://www.tiingo.com/screen/

Let’s see how many stocks increased their dividends 2 times or more in the S&P 500. To do that we simply drag-and-drop the metrics we care about and are left with:

final metrics


Step 3: Run the Screen

Click “Run Screen”

We can see there were only 3 stocks that increased dividends 2 times in the last four payouts.

results

Looking at Macy’s we can confirm this on: https://www.tiingo.com/f/g/m

macys div graph


Want to take it further?

Replace “Dividend_Cash” with any metric in our database. Or, replace .countincr with .countdecr and count the number of decreases!


Enjoy! If you have any feedback, reach out to us at [email protected]

Facebooktwitterredditpinterestlinkedinmail
Presenting Tiingo Comparatives: Changing the Way We Compare Companies

Presenting Tiingo Comparatives: Changing the Way We Compare Companies

When you’re about to purchase a stock, you want to make sure you are getting the best deal you possibly can. Often we’ll compare a company to a couple others, and maybe even try to find out general market conditions. But is that P/E ratio of 18 high or low? Context in markets is everything.

For the first time in history, Tiingo now allows you to compare a company across industries, sectors, and benchmarks by letting you see how they rank each day. We provide context at a level of detail nobody else does.

The Result?

Announcing: Tiingo Comparative Analytics
Get the context behind the numbers.
xom main
Check out the analytics for Exxon here: XOM
We designed this feature because we identified two major issues when looking at market conditions and companies.

1) What are current market conditions?

Before making an investment, investors and traders want to know the economic backdrop. Why buy an energy company like Exxon if you know oil is going to collapse? Or, is that P/E ratio high or low? Answering these questions requires us to have context. Many of us use the P/E ratio of the S&P to get an idea of valuations, but does it make sense to compare energy companies with tech?

So we went to the whiteboard –

Instead of comparing everything to the S&P, what if we could compare industries, sectors, and benchmarks?. The current solutions are to use sector-specific indices or ETFs. But even those only cover the largest companies and don’t provide us line-item data. Also comparing Twitter to Microsoft doesn’t make much sense even though they are both in tech. We need industry-specific data too


A quick example:
Let’s say you want to buy an energy company right now because you think oil will go up from here. But, you also want to make sure the company is stable and can weather a storm. So you decide, “let’s look at a big energy company like Exxon Mobil.”

You see the P/E ratio for Exxon is 12.81, which looks reasonable. But you don’t know what the context of that number means, so you take a look!

valuations 36th


We can see within the “Oil, Gas, and Consumable Fuels” industry the P/E is in the bottom 36th percentile. But what about within the S&P 500? The bottom 19th percentile.

But looking to the right of Exxon, we see Chevron (CVX).


valuations CVX


It has a P/E ratio of 11.51, is also a large company, and its P/E ratio is in the bottom 32nd percentile for the same industry. Additionally, it’s P/E ratio is in the bottom 13th percentile in the S&P.

Assuming all else equal, CVX could be a better way to express our play on oil!

Within one screen we could put Exxon’s valuation ratios within the context of the energy sector.


2) Comparing 2-3 companies is good, but we want to know if we’re getting the best deal

We just compared XOM and CVX, but we at Tiingo don’t feel that’s good enough. Industries, sectors, and benchmarks are filled with companies, so shouldn’t you be allowed to see them all?

We love the idea of data transparency.

With a simple click, you can now see all of the data in tabular form.

xom tablular_pe


In the next few weeks, we will be spending time iterating the current product offerings and making existing features more powerful and accurate. If there is something in particular you would like to see, please E-mail us at [email protected]! We love hearing from our users.

Facebooktwitterredditpinterestlinkedinmail
Why 13-F filings are Poor for Replicating Funds

Why 13-F filings are Poor for Replicating Funds

I’ve seen hedge fund and trader replication ETFs and strategies for some time now and I realized a lot of them are based on 13-F filings.I thought I would go into why these are poor for replication. I hope it’s helpful for some readers out there. And in case I miss something, please feel free to add some more points.

I originally made this post on Reddit, but decided to put it here as well for the readers of this blog. A few Redditors responded and that is below the “Edit” portion below.

1) They aggregate the positions of many different people

Typically the funds they replicate often have a Portfolio Manager structure. Just like with mutual funds you have many different types of funds, on the hedge fund side, you have something similar except you have a ton of different individuals. The 13-F filings are an aggregation of the entire fund so you are seeing the aggregated thesis of the entire fund. You may also be looking at the position of a portfolio manager who fundamentally looks at the world entirely different than you and understands the company in a context you may not. Some people may view this as “crowdsourcing” within hedge funds, but then I present a couple other points.

2) They are delayed

The filings are quarterly so you are getting lagging data. It’s not uncommon for a fund to change positions every month. If you are using 13-F filings, make sure the fund has very long holding periods to account for this. Even then, if there is market-moving news, you wont really know their position until the next report.

3) They show you an incomplete picture

A long/short equity fund will often have a short component. Traders often use pairs trades, or short trades to come up with a trade structure. 13-F filings though only represent the long position.

For example the 13-F filings may be long comcast, when the fund could also be short Timewarner against it. Both companies make up the trade thesis. So even if Comcast loses money, they may be making money on the entire trade as Timewarner was the other leg of the trade. It may appear they are “in it for the long haul” when really you can only see one side of the trade. It’s true long/short equity funds tend to make more money on the long side, but some of that is beta exposure.

What I have used 13-F filings for

1) Trade idea generation.

Sometimes smaller hedge funds will find stocks that I haven’t heard of. I will do my own research though and form my own thesis. It’s almost like a screener I suppose. If I know if a hedge fund is a value fund, a long position may be a value position.

2) To get a hf gig

In college I would look up 13-F filings for local small hedge funds, then research the companies, and cold E-mail hedge funds to discuss the idea. This tended to be received well.

Did I miss anything?

**EDIT:**

Here is what Reddit commenters added – please make sure to give them the karma they deserve

**sayitlikeyoumemeit**
>Yes, 13-F following works best for idea generation from funds with very concentrated portfolios and known for mostly long positions.
One metric that isn’t used much that I like to estimate is the % of overall shares of a particular company that the fund holds (not the % it represents of their own portfolio) . This may give you an even better sense of their conviction in the business. When they start owning close to 20% of a company (many don’t go over this limit because of poison pill arrangements and filing requirements), it implies a high level of conviction, even if it’s a relatively smaller portion of their overall portfolio.

**Mephiska**
(Expanding upon delayed releases)
>Not only that, they will often wait the full 45 day time limit after quarter end to file, so when you see that report you’re already looking 45 day old data.

**FloatsFlysOrFucks**
>Nice post
Could be long the CDS or puts and long the stock to tweak the risk. 13f makes look like the like the position.

Facebooktwitterredditpinterestlinkedinmail
Building the World’s Most Powerful Stock Screener

Building the World’s Most Powerful Stock Screener

I know it’s a bold claim to declare this is the most powerful stock screener out there, so I promise to deliver a bold result. This has been one of the most frequently requested features and for months I struggled with ways to tackle this problem. The end result reenvisions the way we approach screeners to one that is beautiful, intuitive, and has features that nobody has ever seen before.

To check out the screener right away, visit: http://tiingo.com/screen/o

Let’s get into the how and why we made the decisions that we did.

A totally new approach to a UI

A screener is a step in an investor’s workflow and we wanted to capture this. Rather than have a ton of text boxes slapped onto a screen, we took a “stack” approach where users can drag and drop the screens they care about:

drag and drop Drag and Drop Screener


Creation of custom metrics

Because we know we won’t be able to capture every metric people screen for, we allow you to create your own metrics. On our custom metrics page, simply start typing and our entire database of metrics will start to populate.

For example:
Return on Assets (ROA) = Net_Income/Total_Assets

Not only that, you can calculate stats on our fundamental and price data. For example, if we wanted to take an average of the total assets in the past 4 quarters we could do:

For example:
ROA = Net_Income/Total_Assets.mean(4)

A full list of metrics is available on the custom metrics creation screen

Custom Metrics Page


Results are as detailed as you want them to be

Many popular screeners out there won’t show you the values of the metrics you screen for and they don’t let you export to Excel without paying an outrageous fee. Tiingo allows you to do both.

Secondly, since screeners show us stocks we’ve never seen before, how do we learn more? On Tiingo’s screener results page, simply click a company and a box will pop-up showing you a description, a price chart, and the latest news about the company. You never have to leave the results page to learn more about a company.

The Results Page Clicking on Results


Integration into your portfolio

If you notice in the above picture there is a “Corr to Portfolio” column. Tiingo leverages the portfolio tracking tools to integrate into our screener. This column shows you the stock’s correlation to your current portfolio so you can effectively find stocks that offer you the most diversification benefit while staying true to your screening thesis.

Portfolio Correlation column highlighted

Saving screens and metrics

People frequently check screens looking for new ideas, so you shouldn’t have to recreate the wheel every time. You can save both your screens and custom metrics.

Saved Screens Page Saved Custom Metrics Page


Metrics and data not available on any other screener

We are committed to innovating so we wanted to bring important metrics no other platform offered. This includes screens like correlation to global macro factors (Stocks, Treasuries, Bonds, Gold, Oil), and screening not only by an Index (S&P 500, Russell 2000), but also seeing the weight of each stock within that index.

Correlation and Index Weight Highlighted


We deliver on our claims. To check out the screener visit: http://tiingo.com/screen/o

Please note: on the more complicated screens, the calculation may take a few seconds. This is because we hit our most recent data directly, so the values you see are the latest in our database. Also it may take a few seconds because we are a start-up and need your payment for faster servers 🙂

Facebooktwitterredditpinterestlinkedinmail
That’s Enough Machine Learning – thanks!

That’s Enough Machine Learning – thanks!

Alright – so I’m going to hammer on one specific topic that’s been bothering me in the tech scene and that’s just machine learning being thrown everywhere. “Need a t-shirt? Let’s use machine learning to find our different habits and predict our tastes.” Or, you know, you could go to a store and see what appeals to you. OK that’s an exaggeration and going to stores and checking merchandise doesn’t scale across variety the web offers you. But I like this analogy so I’m going to keep it.

The problem I see with machine learning, and why I think it’s overused in markets inappropriately, is that it cannot explain in the same way human consciousness can. What I mean by that is that traditional science tells us to form a hypothesis before conducting an experiment. The idea being that by forming an explanation before seeing the data, we are forced to take current observations and make a rational expectation. This of course leads to biases which is shown quantitatively by the inability to replicate research as well as the number of papers that seem to support their hypothesis. What “big data” (I throw up a little in my mouth when I use that phrase) presents us though is the ability to get instant iterative feedback and A/B testing lets us test our samples in the real-world and see if our models hold up.

This is how it “should” be done. What happens though is that machine learning instead of being used as an optimization method becomes used as a method of find explanations. Many of us are using it to find relationships and then we are are backfilling a hypothesis and shows to be the case. While the current method of science is far from perfect, this approach seems far far worse. I have seen some who can master this, but they often have very strict processes in place to ensure the models hold up. Some enforce it via risk management while others run statistical tests – usually a combination of the two.

But do we really need to use advanced machine learning to create explanatory relationships instead of being an optimization method? After speaking with many people using it this way and reading papers on it, it seems like many doing it drastically overfits and their live results/trading do not match their out-of-sample. A common response to this idea is that, “machine learning should work if we properly out-of-sample tests.” Well, something taught to me by Josh + Steve @ AlphaParity (on this list), was that many people inappropriately run out-of-sample tests. What people often do is they initially have an in-sample and out-of-sample but when out-of-sample doesn’t match the in-sample performance, they parameterize the in-sample until the out-of-sample matches what they want. This creates just one in-sample and no out-of-sample.

Using machine learning as an explanatory relationship finder often leads to complexity of models, which just further adds the probability of overfitting. A secondary problem with markets is that regime shifts can happen rapidly, making machine learning less effective on larger time periods where there become new macro drivers. While it absolutely can be done, I know only one who has pulled it off and I have no idea how they do it. The question is, that all of this complexity worth it? The largest hedge funds out there like AQR do not use it to find explanatory relationships but use it for what it was meant to be: an optimization algorithm that slightly boosts performance. The simplicity of models like this reduce the chances of overfitting and also allow us to know when a model will break – when there will a regime shift. This knowing-when-it-fails allow us to assign higher odds as to when to size down risk (or weighting in non-market cases), or use portfolio construction to provide correlation/diversification benefit.

So before we go crazy with machine learning trying to be predictive from the start, I think it’s worthwhile to test the relationships and run studies and then consider ML at a “tweaking” stage. When used properly, it can be an effective tool, I just don’t think as effective as the mass-adoption of this phrase implies for the vast majority of cases. I think a good example of those who properly used it were the winners behind the Netflix Prize, where their solution is public. Their initial papers explored biases and preferences people had when initially ranking movies. Their final solution contained different ML and statistical methods to push results over the edge. Reading Team BellKor’s Pragmatic Chaos’s papers in sequential order is good fun: Direct link to final paper. Ignoring the math, their logic and explanations are fantastic displays of the scientific method + optimization methods.

Facebooktwitterredditpinterestlinkedinmail
Podcast: Ep.8 Back, Back, Back it Up (Backtesting)

Podcast: Ep.8 Back, Back, Back it Up (Backtesting)


In this Podcast the following material will help you follow along:

Here is a Google Spreadsheet of a backtest where we buy a stock after it falls 5% in 5 days, and then hold the stock for 10 days. The stock is an S&P 500 ETF (SPY). We use this strategy as an example throughout the podcast and here is how you can make one simply using Excel/Gooogle Spreadsheets!

Google Spreadsheet of a Sample Backtest

Are are some other useful resources mentioned in the podcast


Forming a backtest is a skill I’ve spent the past 8 years honing, and after many years of toiling, I share with you some of the secrets I’ve uncovered. Hear the lessons I’ve learned the hard way and the biggest mistakes I see traders and investors make, including experienced ones at banks and hedge funds. This is an easy-to-follow episode that discusses different ways to conduct backtests and the gotchas behind them. I also share a rigorous 10 question check-list I always use when running a new study. This episode is applicable even if you’re a purely discretionary/gut trader as the greatest discretionary traders also rely on historical studies.  And if you’re a data scientist, you’ll especially enjoy this episode.

iTunes Link

Non-Itunes (tiingo.com)

Here is the script that was used in today’s episode.

Note: I don’t follow scripts word-for-word as they can sound unnatural, but the episodes do closely follow them.

Ep.8  Back, back, back, it up (Backtesting)

Listeners! This is possibly going to be one of the most useful episodes for you all whether or not you know what backtesting is. The reason? This is something I spent many many years trying to hone in and understand and was blessed to be mentored by some of the most fantastic people in trading who know this subject well. So this episode is going to be a combination of the past 8 years of my failures, trials, and eventual success in backtesting. Even if you’ve never backtested, or you’re a data scientist and think you know what this is, trust me – this will shape the way you think about the investing and trading.

So briefly? What is backtesting? You’ve actually seen backtesting not only on CNBC, which hopefully you watch sparingly, but also on ESPN! So if you think you it’s too complicated, trust me – you’ve already been exposed to it.

So backtesting is simply taking an investing or trading strategy, forming it into rules, then seeing how those rules performs historically. A simple example you may see on TV is, “when the S&P was down 3 days in a row, it was also down on the 4th day.” Or on ESPN it may be “a 1st round seed has never lost in the first round in NCAA basketball.” Just a heads up: I’m making these numbers up.

So what’s the rule in the first example? You want to see if it’s worthwhile to buy an S&P ETF since it’s been down 3 days in a row and you think it’s time for it to comeback. So you want to see historically if this has worked out in the past. Typically, somebody would make a test that looks back every time the S&P has been down 3 days in a row and then measure if it would go up the fourth day. There are a lot more fun nuances we’ll get into this and how to properly test it.

In the ESPN example, the backtest’s rule is simple: has any #1 seed ever lost in the first round? You go through all the data historically and test to see if that’s ever happened.

Before you shut off the podcast, know that you don’t have to be a programmer anymore to do stuff like this, you can now use things that look very simple. Tiingo actually has tools to do this, and we’re building more, but this is becoming a trend. This podcast episode will discuss some resources where you can backtest things, whether or not you are a programmer or not a programmer. We will also walk through a backtest example that you can do in excel.

I made this episode also because I see backtests in news articles and the media, and often they do it wrong. The tools are becoming much more accessible, even for hardcore programmers, but we still need to learn how to use them. Likewise, having a hammer, nails, and wood wont build a new house. We still gotta learn how to use the tools!

Tiingo Announcements:

And before we deep dive into this, just want to take a quick break to describe some Tiingo announcements. The magazine issue of Modern Trader featuring Tiingo in the cover story is available at moderntrader.com or Barnes and Noble as the July issue. If the issue is out of print by the time you’re listening, ask me and I’ll send you a scan of the Tiingo page so you can listen it J It was a huge honor and we are incredibly thankful for it.

Secondly Tiingo.com is now available in a mobile version, so check it out on your device! It’s pretty surreal to think people now have a high-end financial app in their pockets. I realized I took this for granted, the fact that I can access google, my E-mail, or Facebook right in my pocket…but it really is extraordinary! And now you can access awesome data and a portfolio risk system in your pocket. This wraps up the major UI overhaul and now changes will be more incremental.

Thirdly, Tiingo is now using modern cryptography, so when using Tiingo, your data is encrypted using the latest security measures.

And finally, the fundamental data has received a massive, massive update. We now have structured fundamental data for over 4,300 companies, including companies that no longer trade and very small microcap companies. Not only that, but you can see annual statements in addition to quarterly that goes back over ten years. Annnd to make It even sweeter, you can now see what fundamental data the company reported when they filed, and also see any restatements they made. This is all structured on Tiingo, so it’s pure data, you don’t have to dig through documents anymore.

If you like what Tiingo’s doing, whether it’s the podcast, the website, mission, or so on, we ask that you pay what you can on Tiingo.com/support,  that’s Tiingo.com/support (spell out).

That concludes the announcements so let’s get back into it!

So let’s walk through a tradeable backtest and how we can create one. This will be the foundation for the rest of the podcast. You may notice, I’m going to spend a lot more time discussing how to test a backtest and the problems with backtests, rather than how to create one. This is because there are so many traps you can make as a data scientist in finance and unlearning then re-learning is so much harder than learning it properly the first time.

First, to continue we need to define a backtest study vs a tradeable backtest. Previously we gave examples of two backtests, but if we think back to them, they are not tradeable. If the S&P falls the past 3 days on noticing what happens the next day is an interesting study, but not tradeable. In order for a backtest to be tradeable we need to meet two conditions

  • There has to be a buy condition
  • There has to be a sell condition

Another markets example would be, “what would happen if I bought a stock after it fell 5% in one week?” This is an incomplete back test because it gives us the condition for buying a stock but not selling it. A complete rule would be, “If a stock falls 5% in 5 days, I will buy and hold the stock for 10 days and then sell shares.” Here we have both a buy and sell condition. I’m going to use this example for the rest of the episode.

To test an idea like this, we can simply do this in Excel or Google spreadsheets. In the blog, blog.tiingo.com, I attached a link to this backtested strategy in Google spreadsheets. Before of the feedback from you all, I’ve learned it’s not very effective to walk through a spreadsheet via podcast haha. So we’re going to skip over, but the spreadsheet document on the blog is well-annotated. It also goes through very simply why we use log returns instead of simple returns when doing backtests. We discussed this in a prior episode, so I won’t repeat it here as to what the differences are. The spreadsheet does a much better job than I could do over voice.

Anyway, with the idea of a tradeable backtest established, I want to dig into something else. I want to now dig into the problems I see all the time in both the news media and publications sent out to hedge funds, banks, and so on. And that’s the topic of poor data science in markets.

A quick story before we move on: There is a general rule in financial backtests and that’s “if it’s too good to be true, it probably is.” A few months ago I had a company come to me trying to pitch me their product. Generally when people do this, I always listen because as a guy trying to grind out a new business himself, I totally empathize. In fact, I’ll often give advice back to the owners and spend an insane amount of time crafting the advice. Many of my users and listeners do that for me, so I will do that for others! It’s the golden rule.
Anyway, this company comes to me and pitches me a product with innnnsane performance. I mean the performance of this strategy was mind-blowing. And as soon as I saw it, I asked them a few questions and realized they didn’t understand the mechanics of backtesting. That’s okay, because if you’re new to markets, why would you expect anybody to understand backtesting? Heck, this is kind of embarrassing but I only knew what the Louve was 3 years ago. I never grew up around art or was exposed to it. Sometimes what seems so obvious to us is not so much for others.

But this is kind of an unintuitive concept isn’t it? A strategy performs so well that you know it can’t be real? This company then told us they went to many quant funds and they haven’t won any contracts. And it hit me, it’s because the people who backtest for a living know something is up. My friend who works at a big fund these days saw the company’s business card on my desk and said, “Ah, they spoke to us too. What did you think?” I responded with, “the same thing your company thought.”

My hope is that for all my listeners listening, that by the end of this episode you will know the gotchyas to backtesting. My goal is that if you were the company presenting, you would be able to defend your performance and thesis from people like me. Or if you have a theory on how markets work,  you will be able to test it.

The problem with a poorly formed backtest is that you will lose money. Your backtest will work historically, but fail miserably in the future for reasons we’ll get into. You will trade the strategy with confidence when it only loses you money.

Often, even discretionary traders back-test ideas. If you’re a discretionary trader, a back-test will help you understand how much value baselines give you. For example, you may try to look for stocks that are undervalued, so you may look at a P/E ratio…basically what a stock’s price is to how much money it makes. A low p/e ratio typically means undervalued, but if you backtest it you can see if buying low p/e stocks actually works. Also, if it does work, you can see how often it works. Maybe it works only 55% of the time? That makes it a much lower conviction trade. So this is why even gut traders like backtests, it puts their view and ideas in the context of how they’ve performed in the past.

I make this argument many times, but even if you are a data scientist who doesn’t focus in finance, I believe you will find good value in this episode. The reason is that data science in tech is becoming a hot topic, but finance was forced to innovate and explore this topic long ago. The truth is that in trading, if your backtest or study is even the slightest bit off, you will know pretty soon when you lose money and you will be out of a job. This has made finance approach studies and data science with an intense rigor, and because of the incentives of trading, it’s often beneifical to keep these a secret as you’re competing with others.

So, let me reveal some of those secrets to you all J

The main issues I have found are overfitting and model robustness, the dual in-sample problem, and product knoweldge

So what is overfitting? Well taking the above example that if a stock drops 5% in 5 days, we will buy the stock and hold it for 10 days, it’s very clear why we chose some of those numbers. 5 days are the number of business days in a week. It’s another way of saying 1 week. 10 days is 2 weeks.  5% is also a nice round number.

What if that above strategy returns, on average, a 2% return a year? But we think, “what only 2% a year? That’s nothing, I want more”

So we start tweaking our model parameters. A parameter is something in our model that we can change. In the example backtest, we have 3 parameters:

  • How much a stock drops , the 5%
  • How many days do we measure that drop? In this case we’re measuring the 5% drop in 5 days
  • And how long do we hold the stock for before we sell it? In this case it’s 10 days, or 2 weeks.

After our tinkering we find that we can get the strategy to return an average of 9% a year if we do the following:

If a stock drops 7.62% in 12 days, we buy and hold the stock for 16 days.

But looking at these numbers, what do they all mean? We chose 5% in the original backtest because it was a nice round number and a multiple of 5. But what Is 7.6%? Where does that number come from. And why are we measuring the drop in 12 days? Where does 12 come from? It’s not really 1 week or 2 weeks, it’s 2 weeks and 2 days. And why did we choose 16 days? That’s not 3 weeks, it’s 3 weeks and 1 day.

All of the parameters above were just randomly chosen. And that is the dangerous part.

But you may be wondering, “Rishi, why does that even matter? Who cares, it results in the best performance.” And this is why the problem is so dangerous. With enough tinkering, any model can be made profitable or predictive.

Let’s take a look at example that may make this more obvious. Every week, on a Thursday at 8:30am, the government releases numbers with the number of people filing for unemployment. This is called the initial jobless claims. Many researchers and wall street analysts try to predict this number as it can sometimes move markets. After the 2008 recession, traders watched this release because it helped guide the economic recovery. If the economy was healing faster than people thought, markets would rise. If it was healing slower than people thought, markets would fall – generally speaking.

So Google has a tool called google correlate. What it does is that it allows you to submit Google data, and it tells you what search results were correlated to that timeseries. So I fed Google a timeseries of these unemployment claims. When we do that, we see initial jobless claims correlated to the search word “load modification” with a correlation of 96%. This could make sense, maybe people want to modify their loans because of foreclosure. But we were also going through a housing crises? What would’ve happened in 2001 where it was a tech bubble bursting rather than the housing bubble?

Also, all of the other correlated search results are nonsense. “laguna beach jeans” correlated 95% with unemployment claim data. Does the search result of laguna beach jeans predict initial jobless claims or is that a statistical artifiact?

I’ll let you play with Google’s data for this. It’s fun stuff and Google actually has a paper out that shows how correlate could be a useful tool for predicting economic data. Wow I’ve plugged google like 3 times in this podcast…. Google google google, use google yay. It’s like when I was watching the terminator 2 the other day and I noticed pepsi cans and vending machines.

Just like our correlation example, if we keep digging into data long enough, we find random relationships. This is called overfitting, modifying the data until we get the result that we want. If you’re reading a financial article or speaking to people on wall street, they may refer to overfitting as “data mining.” For anybody in tech or somebody interested in statistics, this is confusing as data mining means something entirely different. In finance though, data mining is almost always used negatively to mean overfitting. That’s just a quick semantical aside.

But even if the relationship makes sense, it may be so specific that it doesn’t work outside of the timeframe. For example, “load modification” may work for a crises related to the mortgage crises, but what about if it was a tech bubble bursting?  Are people googleing for “loan modification” really a good indicator? Also is that data even applicable today? As Google in 2000 was a far different company than today. Will Google search results be an indicator of the future?

So how do we counter overfitting? How do we measure model robustness?

So we just described overfitting and model robustness.


As a data scientist you have to question every single one of your inputs and model parameters. Not just the results, but why everything was chosen.


With overfitting, we really have to practice self-discipline.  This is the tough answer. We as people can always torture and twist data to get us to tell us what we want it to. You can see this all the time when political issues where two lobbying groups will use data to support their idea even though they are polar opposites.  How can both parties use data to prove something? Because they take a some truth and use the statistics they want to tell their side of the story.

Unfortunately for us, if we do that in markets, the markets will take our money. We have to find the truth and be real with ourselves. If we are dishonest, we will lose our own money. This is harder than you think and there are trading psychology books that go into this. To combat overfitting, we have to hold ourselves accountable.

And to hold ourselves accountable, all  – and yes I say all – successful traders – both discretionary and quantitative, have a journal or a process in place. These are individually crafted rules that hold ourselves accountable. Here are a few processes and rules I have that let me make sure I am being honest with myself. Maybe some will work for you, and some may not. And noticehow I don’t include any statistical tests below. Those are my last-stage tests because like I said, we can use statistics to tell us the picture we want. I first like to make sure my ideas have grounding before getting stats involved as it prevents me from twisting data and overfitting.

If you ask any experienced trader, all – yes all –  will tell you simplicity is favored over complexity. You absolutely should specific statistical tests like t-tests, p values, distributions and so on, but that’s beyond the scope of this episode and there are really nice simple visualizations online of them.

Also, if you read the papers published by AQR, the 2nd largest quantitative hedge fund, you will find much of their research is totally accessible and their math does not really get any more complex than calculus, much of it can be done with algebra.

The truth is, and this is something I see often, that machine learning, advanced statistical analysis, and so on do not make a better trader. In fact, it gives you more creative ways to part with your money. I see it all the time, and you would be surprised with how simple many quantitative trading strategies can be. I’ll add some links to AQRs papers if you don’t believe me in the blog – blog.tiingo.com

And an aside for those of you who hear about machine learning: right now machine learning in markets is sexy and sells, but remember it very rarely makes money by itself. It’s not the holy grail of trading. In fact, every quantitative trader I know who uses machine learning, uses it after many years of getting their models working without using it. The ones that do use it, often use it as a last optimization. And even the traders I know who use it, I can count on one hand. Their profitability did not drastically change once they used machine learning.  The blog will contain papers by big hedge funds just to show you how simple the math can be.
Anyway, here are some of my snippets I use to hold myself accountable and make sure my models are flexible and robust. The accountability and overfitting really go hand in hand.

  • Why would this idea work? What is the current research and conditions out there that support why this would and wouldn’t work
  • What is my hypothesis, or null hypothesis – what am I testing?
  • Are there any relevant research papers out there? Can I replicate them? My trading mentor told me he’s only been able to replicate 20-30% of papers, and I have found about the same to be true. Some of the errors in research papers out there are horrible
  • Should this theory or idea work across markets and/or across stocks? Or does it only work for one stock or one asset class? If it only works for one why? This is a huge warning sign for me. If looking at stocks, it should at the very very least work in the sector.
  • What is the risk adjusted return of this model? Basically what is the average return and volatility of this model?
  • How many times did I run this model and change parameters? How many times did these changes result in better performance? Keeping a tally of how many times you tweaked parameters is a good way to be honest with yourself about how much you tortured the data
  • Does the model trade all stocks equally or is the majority of returns driven by a couple stocks
  • For all the big gains and losses in the strategy, check them manually for data errors
  • When will this strategy fail? This is such an important question. If you don’t know when or why this strategy fails, then you don’t really know the strategy or all or why it makes money.
  • How does the profitability of a strategy change if I slightly tweak a parameter? Is there a relationship between how much I tweak the parameter, how much the profitability changes?


This is an incomplete list, but I think it’s a good starting point.

One thing that people do to help prevent overfitting in the in-sample and out-of-sample  backtest. But I’ve found this often results in something I call the dual-in-sample error.

Facebooktwitterredditpinterestlinkedinmail
Podcast: Ch.1 Sifting Through the Noise and Taking Action – A Chat with Garrett Baldwin

Podcast: Ch.1 Sifting Through the Noise and Taking Action – A Chat with Garrett Baldwin

When I started out in finance, and even now, I get bogged down whenever I read certain financial news outlets. Even after years in the industry, it is tough to weed out what’s important and who is credible.
That’s why I asked Garrett Baldwin, an esteemed financial journalist, academic and the managing editor of AlphaPages.comFutures MagazineModern Trader, and FinAlternatives to be a guest on the podcast.

In this episode, we talk about a variety of topics including Garrett’s journalistic process,  holding Wall St. analysts, journalists and bloggers accountable, and tips on building an investment process.

Check out the podcast to learn how financial journalism is changing and how the latest financial technology tools can help us sift through the noise to find meaningful, actionable data.

Garrett also mentions the Tiingo community in the cover story of his newest publication coming out:  Modern Trader (Available June 23rd at Barnes & Noble, E-mail will be sent out).


Here are a few resources we discussed in the episode:
Estimize
Modern Trader
OpenFolio
EidoSearch

Garrett is the Managing editor of AlphaPages.com, Futures Magazine, Modern Trader, and FinAlternatives. In this episode, we touch upon a variety of topics including the journalistic process in finance, holding Wall Street analysts and bloggers accountable, and tips on building an investment process. Learn how financial journalism is changing today and how the latest financial technology tools can sift through the noise and find meaningful, actionable data.

iTunes Link

Non-Itunes (tiingo.com)

Given the back-and-forth nature of this Episode, there is no transcript.

Facebooktwitterredditpinterestlinkedinmail
Podcast: Ep.7 Our First Hedge Fund Strategy

Podcast: Ep.7 Our First Hedge Fund Strategy


In this episode we cover not only what hedge funds are, but one of the most recently used hedge fund allocation strategies: risk parity. The largest quantitative hedge funds are using this method and it is now presenting some real dangers. We use this example to touch upon how we can skeptically look at performance and also what to beware of with 13F filings. This episode synthesizes everything we’ve learned into a single practical episode.

iTunes Link

Non-Itunes (tiingo.com)

Here is the script that was used in today’s episode.

Note: I don’t follow scripts word-for-word as they can sound unnatural, but the episodes do closely follow them.

Get excited listeners. We’re going to synthesize everything we’ve learned to create our first hedge fund strategy and go over what a hedge fund is. If you haven’t listened to the other episodes, that’s okay because this can be a good test to see if you need to brush up on anything. For the most part though, this will be a very simple explanation so relax and enjoy listening.  Oh! And I even made an entirely new feature and initiative on Tiingo to aid in this episode.  Actually, I had this podcast all scripted out and then I realized, “I should just make this hedge fund tool for everyone.” So… this is going to be a really fun episode.

I consider this an important episode because we’re going to be using some metrics we’ve learned about and touching upon new ideas like risk management and position sizing and what they mean. We’re also going to discuss criticisms of the hedge fund strategy we’re covering, which will give you a look into how we should all view markets and claims made by individuals. One of the most important skills you can develop as an investor and trader is skepticism.

Here is a fun story that upsets me quite often. I used to work at a big bank, and there was a Managing Director there. A managing director is the most senior title you can get at a bank before you get into CEO or CTO.  In other fields it may be called a Principal, Partner, and so on. Point is, it’s a very high title. Well this MD, managing director not medical doctor, was followed across wall street because his research was popular. What the bank didn’t advertise was that this MD originally traded, but because he lost money for 7 years straight, they no longer allowed him to trade with bank money and instead allowed him to publish research because it helps their relationships with clients. Another fun point? Of the people who read his research, half of them mocked him and used him as a joke of everything wrong in market analysis. This MD would literally look at a price graph and then draw arrows. That’s it. He would circle things, and draw arrows where he thought things were going.

I rarely trash talk as you know in this podcast, but I bring up this example to highlight how important skepticism is. Even if you think somebody is a pundit or brilliant, fact checking is incredibly important. Misinformation is so dangerous because it means we can lose our money. It’s one thing if the misinformation is a genuine mistake and a person tried, it’s another if an institution knows a person had bad research yet still promotes him for sales. I will never stand for the latter and will continue to be vocal on this.

So to recap: always be skeptical. Even of me. Verify everything I say. I try my best but I am human so if you think I’m wrong, please check. If you don’t think I’m wrong, then definitely fact check me! Haha, that’s an important lesson!

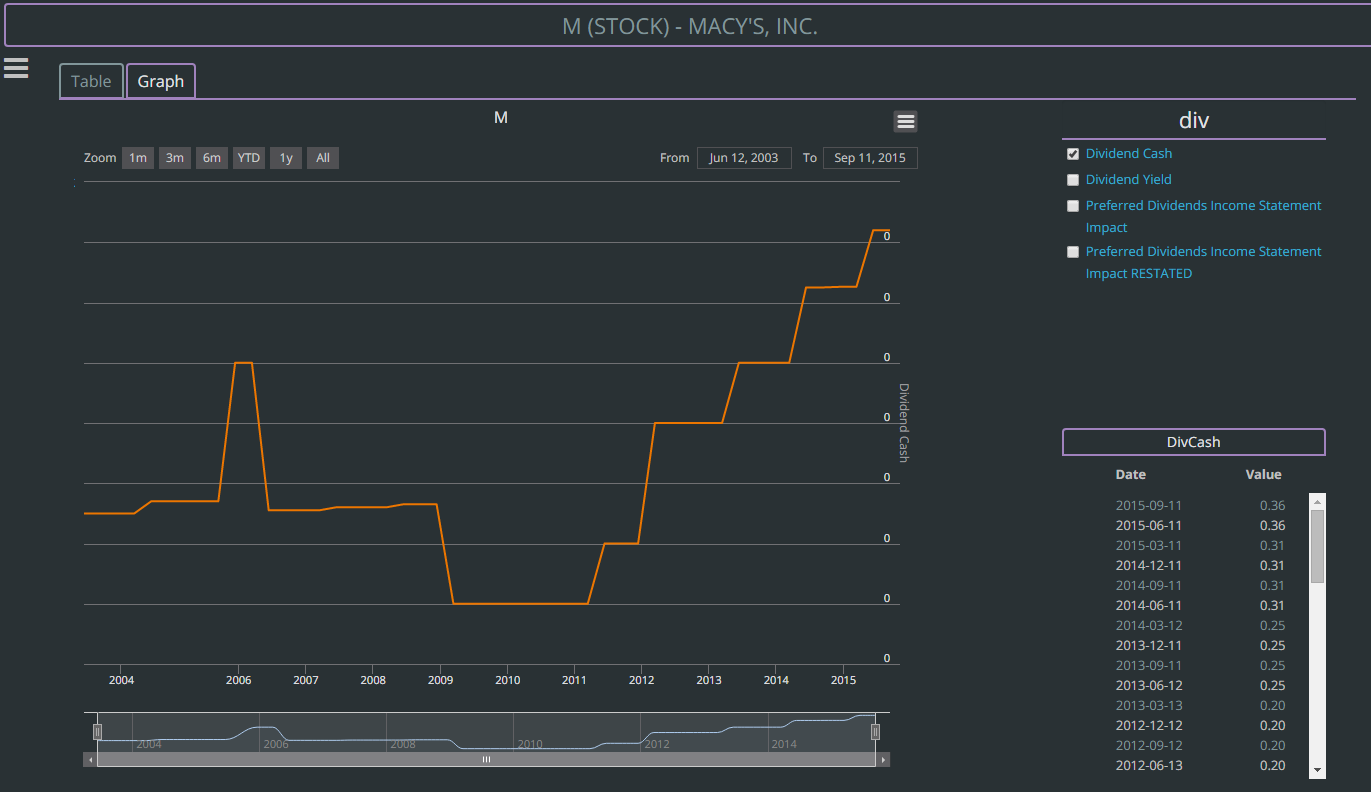
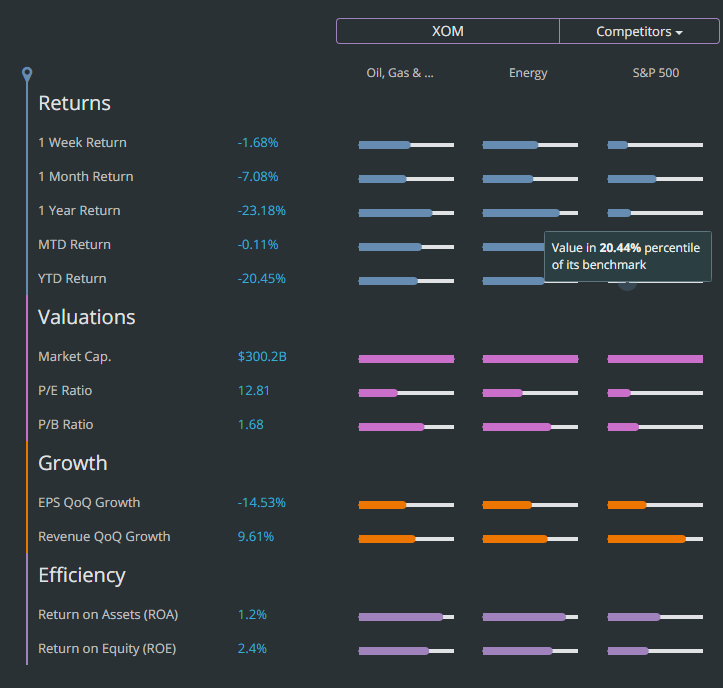
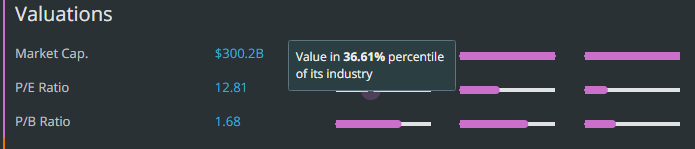
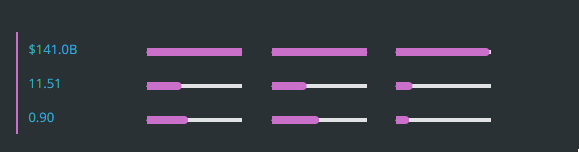
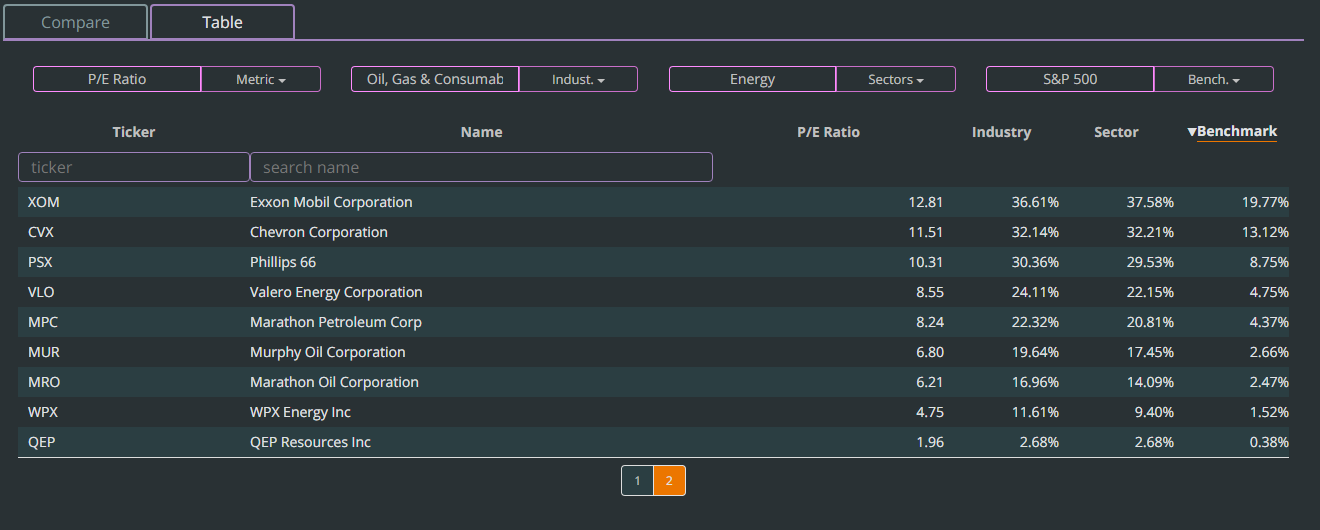
OK moving on to some quick Tiingo announcements. This week we have revamped the entire fundamental database so it has the data structured in tables as well as graphs. The data is now also more accurate and had extensive coverage for over 3,500 stocks.  Secondly, I have started the Tiingo Labs initiative, which contains a powerful tool you can use with this podcast. And thirdly, I just added a chat reputation system, as well as something called a Tiinglet. I realized some of the best converrsations among friends happen within chats, but we don’t have a way to save them down. I present a Tiinglet, it lets you turn your discussion about markets into something you formalize and give to the public to help others learn. If you open the Tiingo chat, click a username of a message you like, a box will come up and within a few clicks, you will make a site centered around your dialogue.

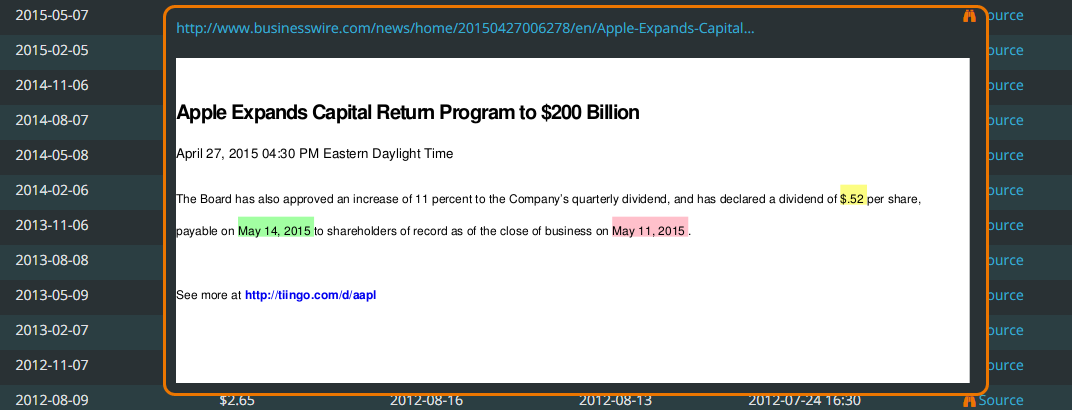
For example, if you and a friend are talking about Apple and one of you comes up with great analysis you think you could help others, then you can simply click the text and a message box comes up that lets you turn the conversation into page that is accessible to others who may have the same questions as you do.

In addition, if you like the Tiingo project – the mission, podcast, web app, and so on, please consider paying for Tiingo at http://www.tiingo.com/support once again www.tiingo.com/support. I have a pay what you can model so nobody is excluded, but in order to exist, we will need people to pay for the product.

So let’s move on into our first hedge fund strategy!
To begin let’s discuss what a hedge fund actually is and how news can often misinterprets what they do.

A hedge fund’s goal is to make money that’s uncorrelated to other assets like stocks, bonds, and so on. Think of it as if you invested in real estate. If you bought a condo,you probably wouldn’t compare it to stocks. In fact, many times people invest in property to build equity or have other investments besides stocks and bonds.

So it’s not so much hedge funds have to make more money than the stock market like the S&P 500 or NASDAQ index funds, but that they have to have a return stream that differs from those.  They are a tool used by pension funds, wealthy people, banks, other institutions, and so on to diversify away their risk. For example, if you had 10 billion dollars, stocks and bonds may be nice, but you may want to have other investments too like real estate. So think of a hedge fund as a tool used by wealthy investors to diversify away some of their risk.

You may often see headlines that say, “the stock market returns 20% this year, but hedge funds only returned 12%.” But that’s not a bad thing. A hedge fund’s goal isn’t to beat stocks, it’s be uncorrelated for stocks. For example, if stocks were up 20% and a hedge fund was up 20%, and if stocks were down 10% and a hedgefund was down 10%, why would you pay fees to a hedge fund when you could own an index fund?

So to create strategies uncorrelated to the stock market or bond market, a hedge fund will trade in different styles. They are considered active managers. They also have a tool called leverage. This simply means they can borrow money. If they have $10,000, they may trade as if they had $50,000. They can also sell short, a topic we covered in Q&A. This differs significantly from mutual funds and index funds, which tend not to really use leverage in the same way, and also mutual funds and hedge funds don’t sell short. Because of this, hedge funds are often classified as an “alternative investment.”  They are alternatives to traditional assets like stocks and bonds. They manage money in what is considered non-traditional ways.

Some hedge funds may be long a stock while being short another stock. This is called a long/short equity fund. Others may trade commodities or fx, and these are often called global macro funds. Some hedge funds employ quantitative strategies where they build computer programs that decide what to invest in.

One problem you see in the

The fee structure for a hedge fund is often more aggressive than a mutual fund or index fund. It’s typically assumed a fund takes 2/20 (2 and 20) or maybe you will see 1.5/15. Let’s use 2/20 as an example. The first number, 2, is the management fee.  This is similar to a mutual fund. If you invested $1mm, you would pay 2% of what you invested. IN this case it would be 2% of $1mm, or, $20,000. The second number, 20, is the cut they get based on performance. For example, if they make 15% on $1mm, or $150,000, they will get a cut of that $150,000. The second number represents the % cut they get. So if it’s 20%, they would get 20% of $150,000 which is $30,000. So 2/20 (2 and 20), is a 2% management fee on what’s invested, and a 20% performance fee which is shaved off the additional money they make. If the hedge fund doesn’t make money, or losses money, they still get the management fee but do not get the performance bonus. They get the 2% but not the 20%.

So a hedge fund is a pooled investment, like a mutual fund or index fund, but they take investor’s money and then use alternative strategies to make money in different ways. Their goal is to make money regardless of market conditions while also being uncorrelated to other assets. As usual this should be the case, but often time isn’t.

Anyway, this is what a hedge fund is. It often has a mystique to it like hedge fund traders are brilliant. But just like any profession, you have people who are very good, and others who may not be so good. Often I find the media portrays hedge fund managers, especially quants, as these super brilliant mathematicians. Having gone to that side, I can assure you…unless it’s High frequency trading, the Ph.D.s and the chess champions don’t make a difference.  They’re just normal people that are incredibly passionate about markets.

Now that we know what a hedge fund is, we are going to discuss a popular strategy using the knowledge we’ve gained. We need to understand volatility, correlation, and stock indexes and etfs.

So a hedge fund takes a non-traditional approach to investing. Do not try what we’re discussing at home. There are a lot of caveats to a strategy like this, some of which we’ll get into, but making sure this is done right takes a lot of practice.  I don’t want to be responsible for any execution errors or mishaps. This strategy is not guaranteed to make money, and in fact could very well lose you money. Anyway, with this very scary, yet important disclaimer aside, let’s move forward, woo-hoo!

We’re going to discuss a strategy called a risk-parity strategy. Actually, risk-parity is not a strategy but an allocation method. That simply means, it’s a method to determine how much money you should put in each asset you own. What I mean by that is if you own a stock index fund and a bond index fund, how much should you put in each? In episode 3 we discussed two different ways to determine this, one was simply always keeping 60% of your cash in stocks, and 40% of your cash in bonds. We spoke about how this is naïve because it stays the same regardless of other factors. For example, if you are younger, you may be able to take greater risks, which will let you be in more stocks.

In the same way, a risk parity strategy helps you decide how much to put in each stock. We’re going to use the 60/40, 60% stock, 40% bond, portfolio as an example for this strategy.

So a big trend among large hedge funds, like AQR and bridgewater, is to determine how much to put in each asset using a risk-parity strategy.  They may add a few twists to the idea, but at it’s base core, a lot of it is determined by this method.

So what is risk parity? Well it simply means equal-volatility weighting your portfolio. Before you shut off this podcast, I will actually explain what that means. I can’t stand when people define terms using equally difficult terms or phrases so I won’t do that to you.

So you know how in the 60/40 stock/bond portfolio 60% of our cash was in stocks, and 40% was in bonds? Well we generally assume stocks move around a lot more than bonds do. Bonds are assumed to be a bit more stable.  This is a concept we call volatility. We say, on average, stocks are more volatile than bonds.  Typically, many people measure risk as volatility. Something that moves around a lot, could be said to be more risky. So sometimes volatility and risk are sometimes said to be synontmous.  SO breaking down the term, risk parity, we can say volatility-parity. And parity means for something to be equal.  Using these definitions, we can say “risk parity” roughly translates to “volatility equal”, or more naturally, “equal volatility.” Risk parity means equal volatility.

But what does that mean practically? A common example is if you take a 60/40 stock/bond portfolio, and measure the volatility, we see 90% of the volatility comes from stocks, and 10% of the volatility comes from bonds.  Going forward we are going to use the term “cash.” This means exactly that. If we put 60% of our cash in something, it means if we had $1,000, we would take $600 and invest it in stocks. We would then take $400 and put that in bonds. a 60/40 portfolio is 60% cash in stocks, 40% cash in bonds.

If we took 60% of our cash and put it in stocks, and 40% of our cash  and put it in bonds, 90% of the movement would come from stocks. Only 10% of the movement would come from bonds.  Because stocks are said to be higher risk, or higher volatility in this case, they would make up 90% of the risk in your portfolio, even if they were only 60% of the cash.

So what risk parity says is that we should make stocks only take up 50% of the risk, and bonds make up 50% of the risk. If 60% cash results in 90% risk, how much would we have to scale back? Well if we put 33% of our cash in stocks, that would make the portfolio take up 50% of the risk.

What about bonds? Well since 40% cash results in 10% risk, if we multiply our bond position by 5, we can get 50% risk. That means we have to take the 40% cash position/10% risk position, and multiply both by 5. We can see that 200% cash in bonds results in 50% risk.

But how do we put 200% of our cash in something? Well this is a concept called leverage. This is something hedge funds can do as we mentioned earlier, they can essentially borrow money to multiply their returns.  Individuals can do this too through margin and futures, but we’re not going to cover this here quite yet as this is a more advanced topic and has serious risks involved.

So to recap, in order to take a 60/40 stock/bond cash portfolio, and make the portfolio 50/50 in volatility/risk, we have to cut the position of stocks and lever up the position in bonds.

Notice how we are using the volatility of an asset to determine how much to allocate? This is a dynamic method, and no different than if we did 60/40 or another allocation method. So risk parity just tells us how much to put into each asset. The strategy will tell you what assets, and risk parity will tell you how much to put in each asset.

So let’s get down to it, how much would this strategy make vs a 60/40 strategy? And here is where things are gonna get SO fun.

The risk parity strategy returned 45% total over the past 12 years. The 60/40 portfolio returned 61% total. This wasn’t assuming reinvesting dividends for those wondering – if you want to ask my why shoot me an E-mail.

So you may be thinking,”Rishi you said this was profitable…but I would make less? What is wrong with you.” Well here is the key information and why hedge funds can do this better than 60/40. We have to look at how this strategy performed relative to the path it took. In episode 5 we talked about volatility and how the path to the return we got matters. For example, if invested $100,000 and doubled our money to $200,000 that’s awesome. But what if half way through that $100,000 turned into $50,000?

Likewise, what if you invested $100,000 and made $150,000 but the lowest your portfolio ever got was $99,000. Which would you prefer? Even if you’re telling me the down $50,000 scenario, here is why it’s still worse if you’re a hedge fund.

The risk parity strategy had a volatility of about 5.5%. The volatility of the 60/40 was about 11%, almost double. So what a hedge fund will do is that they will apply even more volatility, because investors want a higher return. So to compare apples to apples, a hedge fund may use leverage and double the amount of money into risk parity, so you take that volatility of 5.5% and double it, and now you have 11% volatility. But you also have double the return.
So if we want to compare apples to apples, we should also compare the volatility, or the path it took us to get to the return we have. So if you double the leverage to a strategy, you not only double volatility but the return. So that 45% we made on risk parity becomes 90%. 90% on risk parity vs. 61% on a 60/40 portfolio. There are a bit more nuances to this strategy that actually improve performance of risk parity, but we’ll get to that soon enough in this podcast series.

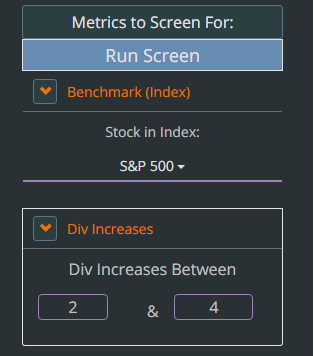
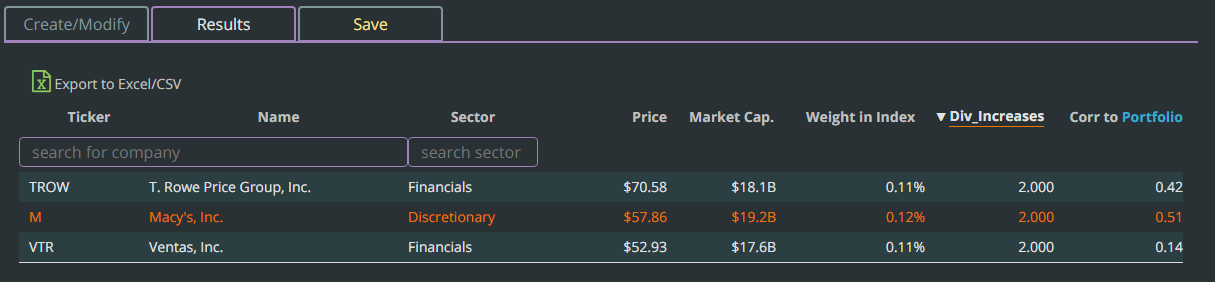
If you want to play with this risk parity allocation method, I mentioned I created a tool to help you do this. Know this is an informational tool and you should not trade on the results. I have not put in tradeable assumptions, but this is a good informational off-the-cuff proof of concept. And please treat it as such, it’s not a full replication of the strategy nor how much you should invest. So with that diclaimer, check out the tool on Tiingo.com/labs. You’ll see a link that has risk parity. This is a sweet tool that may let you get an idea. You just type in the tickers you want in your portfolio and press enter. Maybe you want to include the S&P500, bonds, but also small cap stocks? But anyway, the possibilities are endless and I hope you find joy and fun is playing around with this!

The next question we have to ask ourselves, is why does this strategy perform so well?

This is where skepticism in markets is so critical. If a strategy performs very well, it’s important to ask ourselves why? What conditions are allowing it to perform so well? Is it the economy, maybe government policy? Certain changes in technology?

In this case, the common explanation of why risk parity does so well is especially from the bond market. In the U.S., for the past 30 years, bonds have done extremely well. They’ve never really gone down for an extended period of time like stocks have. And after the 2008 crises, the Federal Reserve, which sets an interest rate that bonds are affected by have gone down. The Federal Reserve, or Fed, did this to promote credit and boost the economy. We will get into how that works later, but the take away is that fed policy has allowed rates, like loan or mortgage rates, to stay low. Not only that, awhile ago the Fed committed to doing that for awhile.

In Episode 5 we mentioned how uncertainty creates volatility. Well, when a book government agency that influences rates says, “we’re going to do this for a long time” it removes a lot of uncertainty. This in turn removes volatility from bonds.

So what we’ve seen are that bonds are performing very well, the price goes up. If you’re new to bonds, it’s said the price of bonds is inversely proportional to the interest rate. What that means is that if rates, like you see on loans, goes down, the bond is worth more. We will cover this more in depth later, but if rates are up, bond prices are down. If rates are down, bond prices are up.

So since the Fed committed to keeping rates low, you’ve seen bond prices go up. Secondly, you’ve seen a lot of uncertainty removed in the bond market, resulting in low volatility. And since risk parity equal-volatility weights, in order for the volatility to be 50-50 stocks and bonds, hedge funds have bigger positions in bonds.

So the argument against risk parity is that it applies an unfair amount of leverage to bonds. To mitigate this, hedge funds look at the volatility every month, and do what we call “rebalance.” If volatility was higher for an asset the previous month, they will put less money in the asset the next month. Every month they make take the average volatility for the past 3 months and add or reduce their position in each asset.

However, rebalancing happens once a month. What if the price of bonds fell quickly within a month. Let’s explore it for a moment.

In our example, we borrowed double our money to invest in bonds. Let’s say we had $1,000 and borrowed another $1,000. The $1,000 we had is our equity. So if bonds fell 50%, we would lose 50% of the combined value of $2,000. We would lose half, so $1,000, which would completely wipe out our equity.

If we levered 300%, so we had $1,000, but borrowed another $2,000, a 33% fall in bonds would be a loss of $1,000 and wipe out our equity. The equity is what we actually have, so if we lose all of it, we go bankrupt.

The truth is though, with hedge funds, if they are down 20%, investors get scared and often pull their money away. If your mutual fund was down 20%, you would probably rethink the investment.

Right now, a big worry among investors in hedge funds is that the economy has been doing pretty well. So when is the Fed going to allow interest rates to rise? And what if it happens really quickly? If rates rise quickly, the price of bonds will fall quickly. And remember, the top hedge funds are using this strategy and they manage $200bn among the top few alone. If these $200bn is highly levered, imagine how many billions could be wiped out if bonds just fall 10%.

This is similar to the 2008 crises. Many people were hurt because banks were offering low down-payment mortgages, and that just means people levered. a 10% down payment means you are levered 10:1, or 1000% on your equity. If your house dropped 10%, you were wiped out. This is what hurt people.

In the same way, a big worry is that because funds are so levered on bonds, if they fall in price, you could see billions of dollars wiped out. Funds have tried to come out and recognize this problem and are taking steps to address it. I wont comment specifically if I think these steps are appropriate, at least not publicly, so if you want to have that discussion, shoot me an E-mail!

The caveat though is that leverage needs to be used appropriately, and many people think the reason this strategy has done so well is because bonds have done incredibly well over the past 20 or 30 years. Stocks have also done very well in the past 6 years, so this keeps adding to the returns of the strategy.

These are the drawbacks and everytime you see performance numbers, always ask yourself why? Asking why an opportunity exists is not just a powerful tool in business, but also markets. Maybe there is a reason this strategy works that may make you feel uncomfortable.

Either way, I know this is a lot to take in, so if you have to repeat a few parts, I apologize. But this example is truly an expression of how we can combine the things we learned so far into a strategy the largest hedge funds are using.

This has been fun and if you have any feedback please E-mail me at [email protected]

Facebooktwitterredditpinterestlinkedinmail