Tiingo Launches Live Chainlink Node to Provide Signed End-of-Day Equities Price Data On-Chain
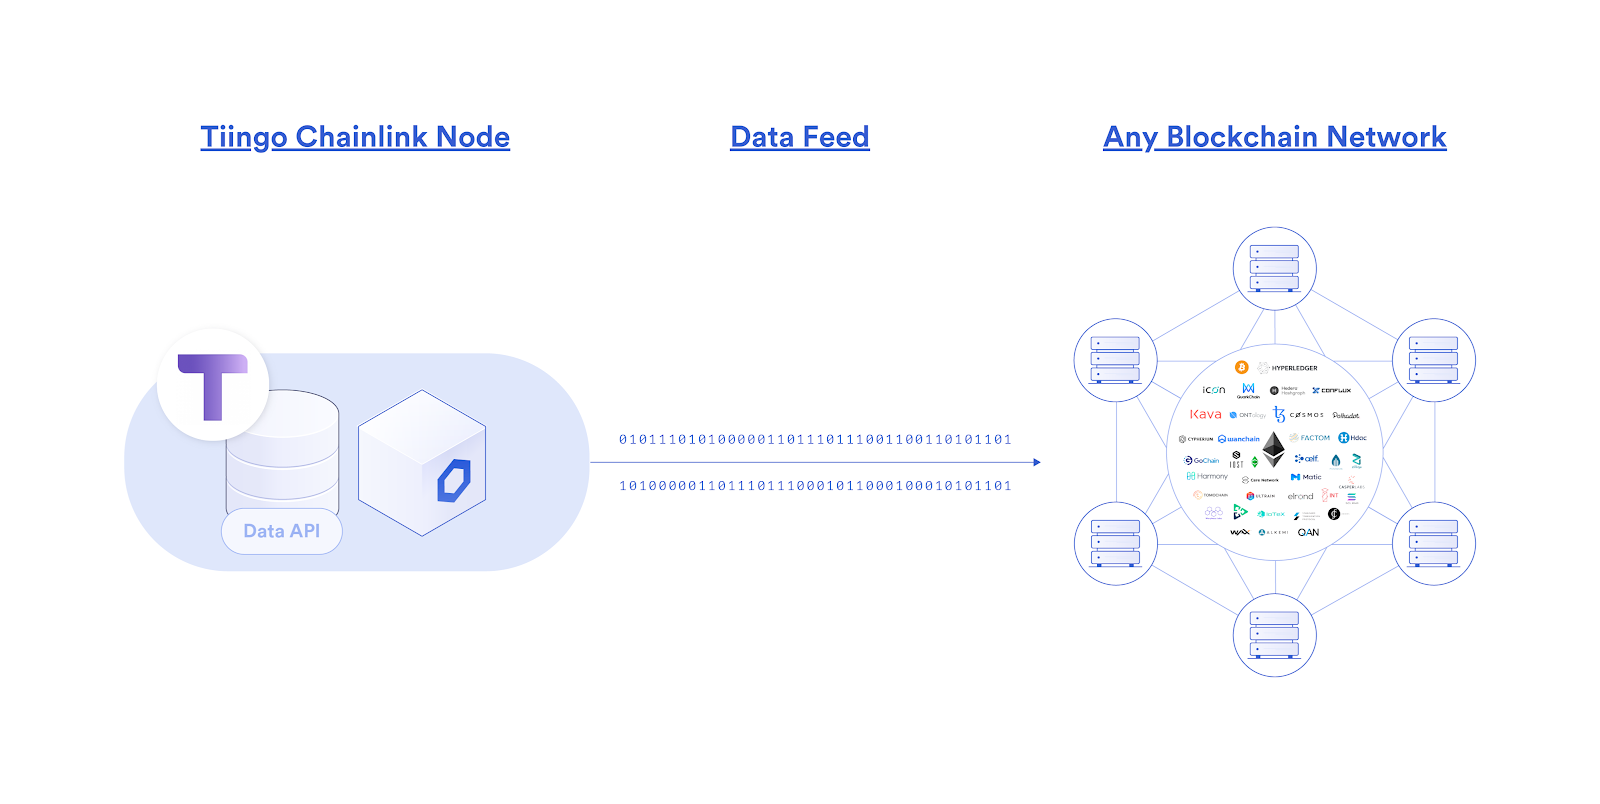
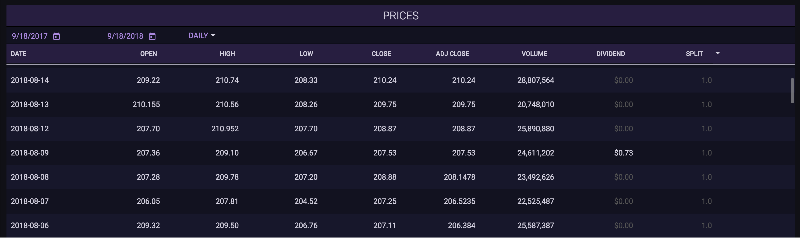
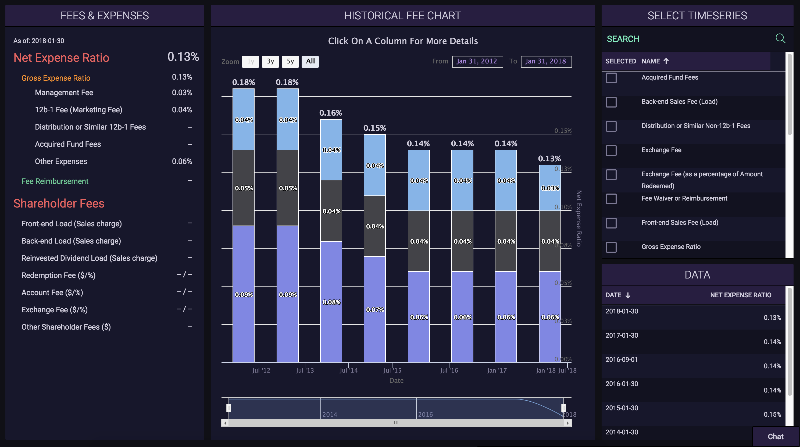
We’re excited to announce that Tiingo has launched our own Chainlink node live on mainnet, bringing our financial market data directly to blockchain markets. Our initial journey will start with providing cryptographically signed end-of-day equities price data directly on-chain, with several DeFi applications already set to consume it. This enables a whole host of new DeFi markets to exist, specifically built around U.S. equities, such as perpetual derivatives contracts, synthetic assets, rebasing tokens, and more.
Being the most widely used oracle solution in the market, Chainlink was the clear choice in blockchain middleware necessary to get our existing API’s blockchain enabled across all the leading networks. Not only does the Chainlink node allow us to sell our API data directly to various blockchain applications, but we can sign our data on-chain to prove its origin as being from Tiingo, further adding to its reliability when settling DeFi contracts. Additionally, the node setup process was very easy and seamless, requiring minimal technical effort to get our API data exposed to a much wider range of markets.
For more information on why we opted to use Chainlink to monetize our data for blockchain markets, check our previous announcement. To learn about how to access our node, visit https://docs.chain.link/docs/tiingo-eod-stock-price-oracle.

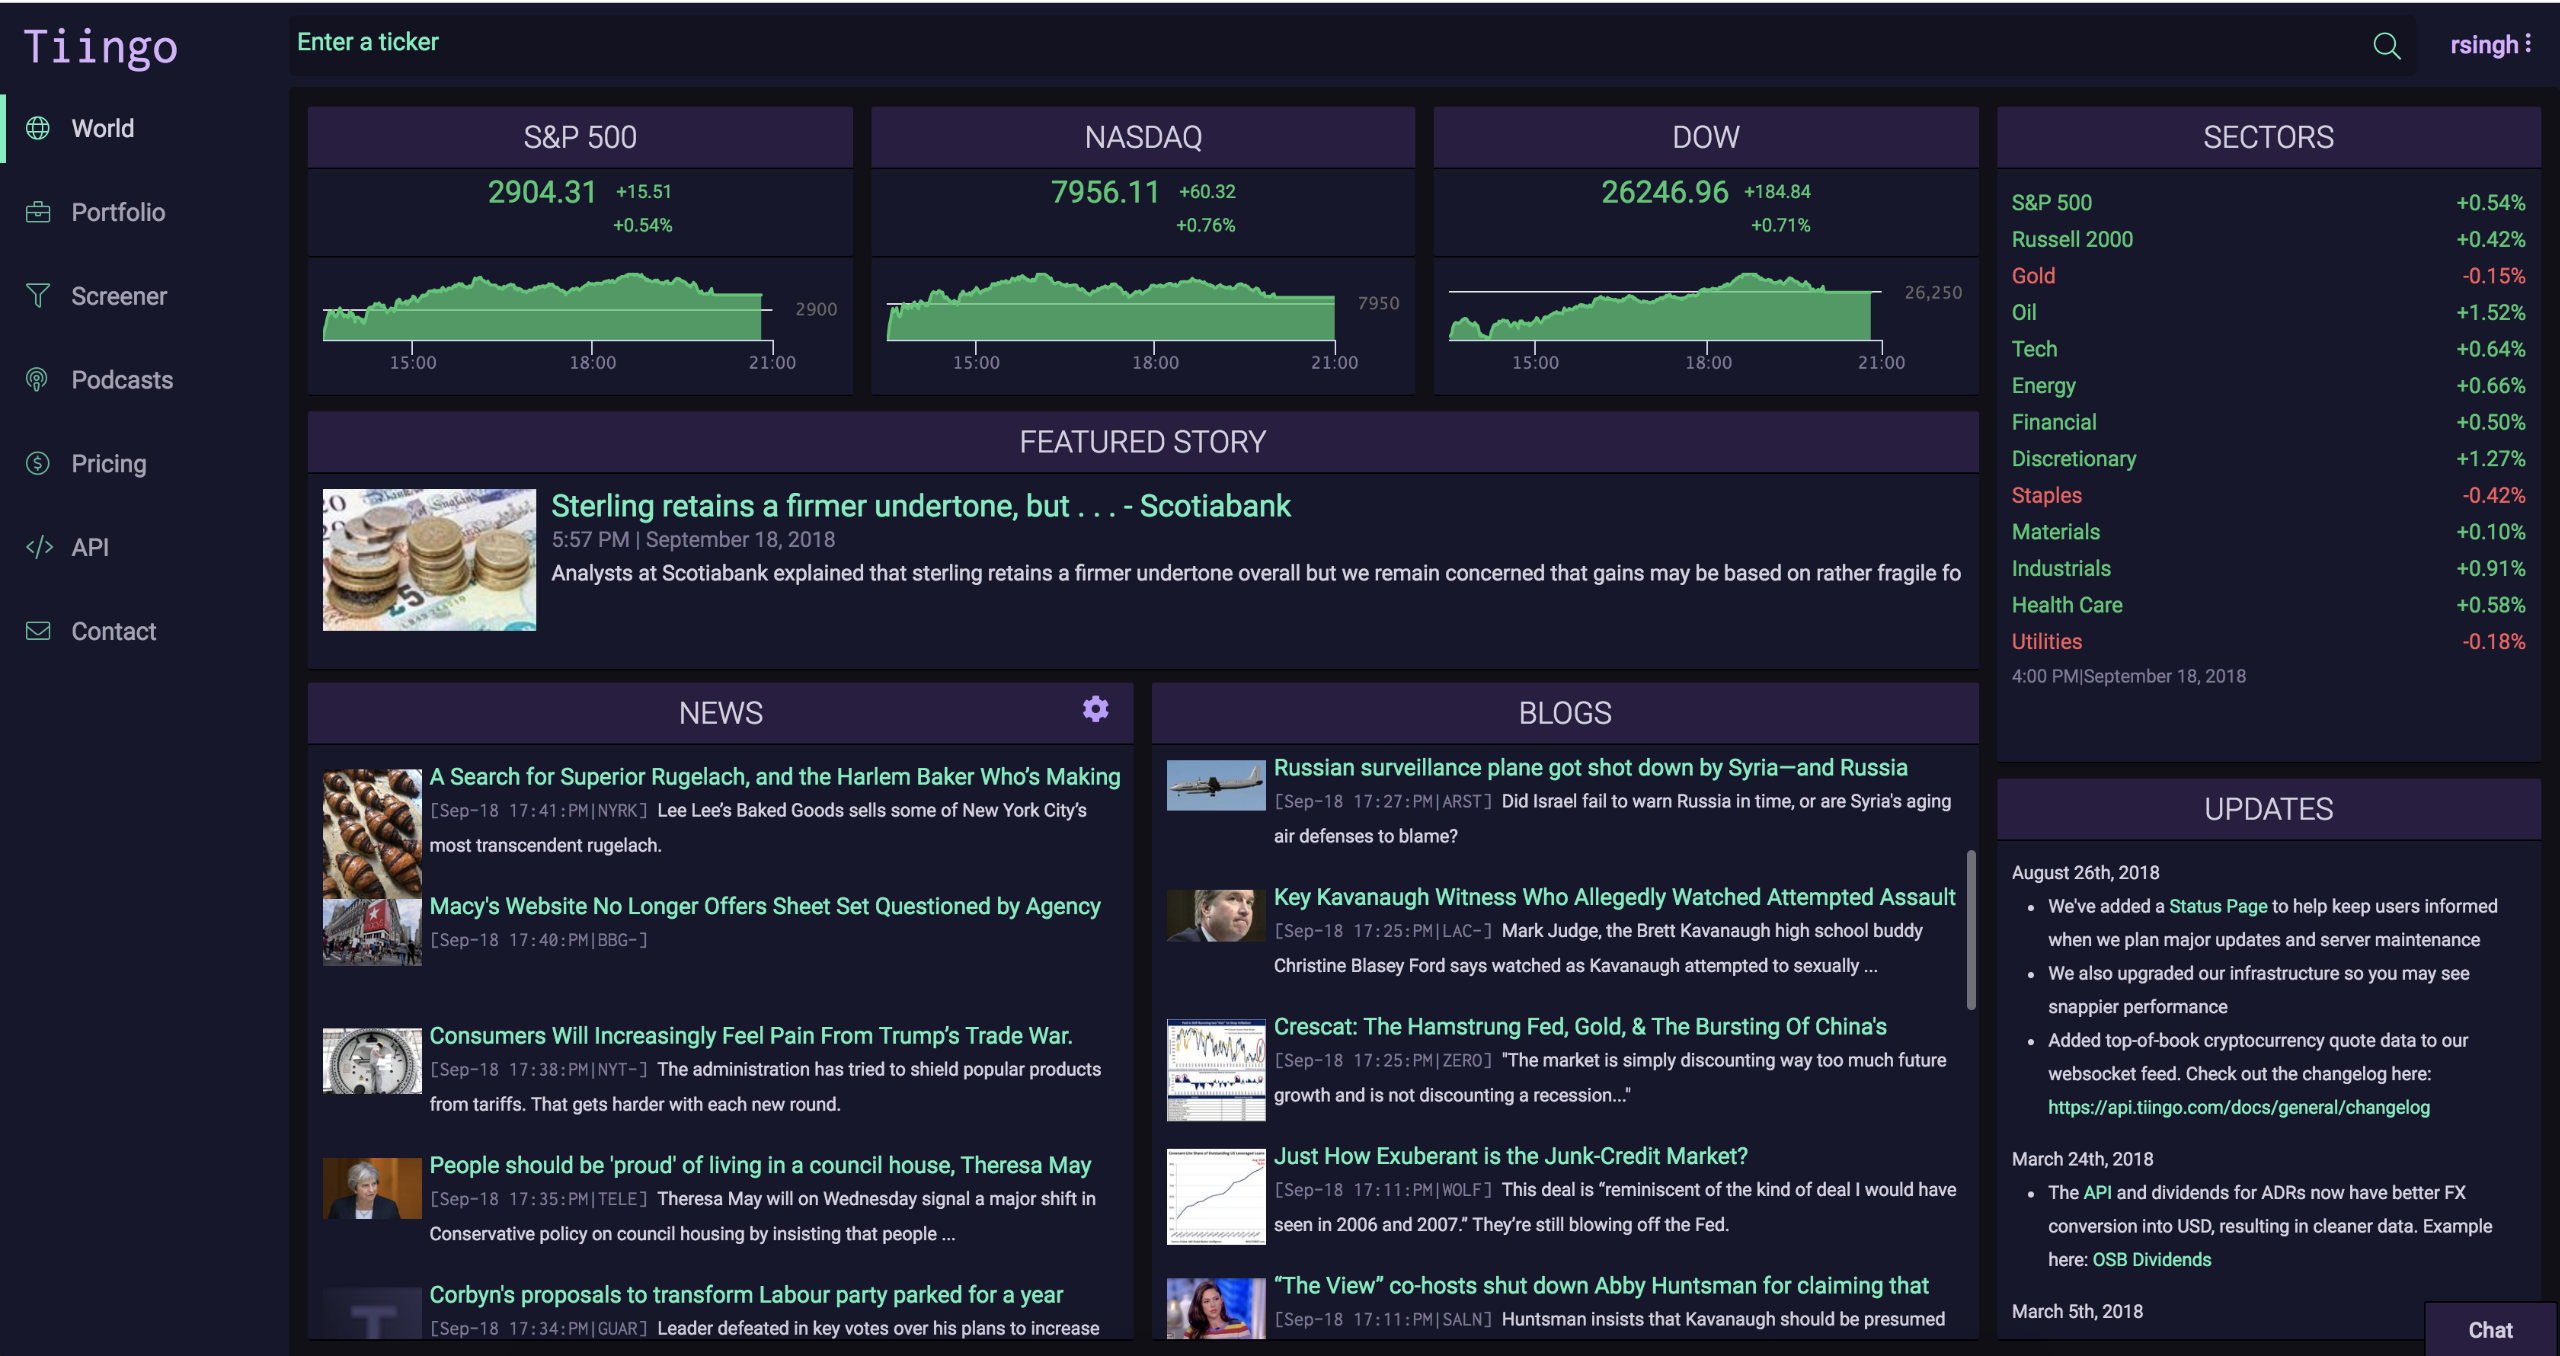
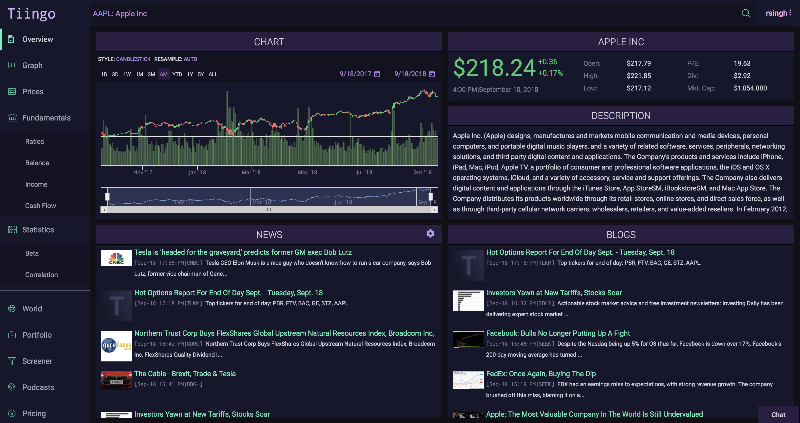
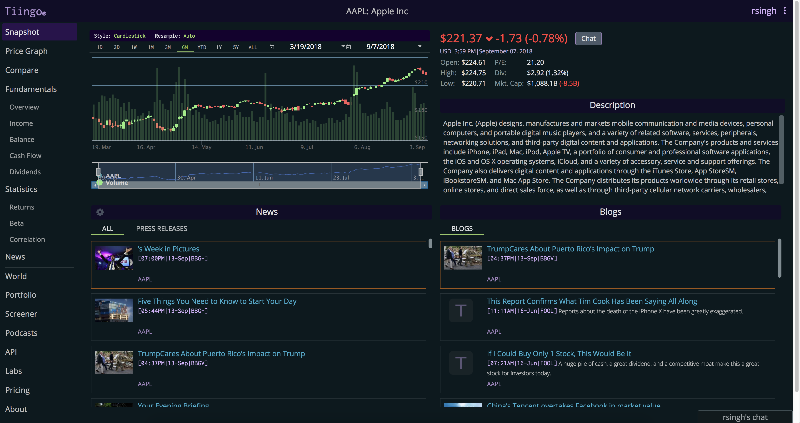
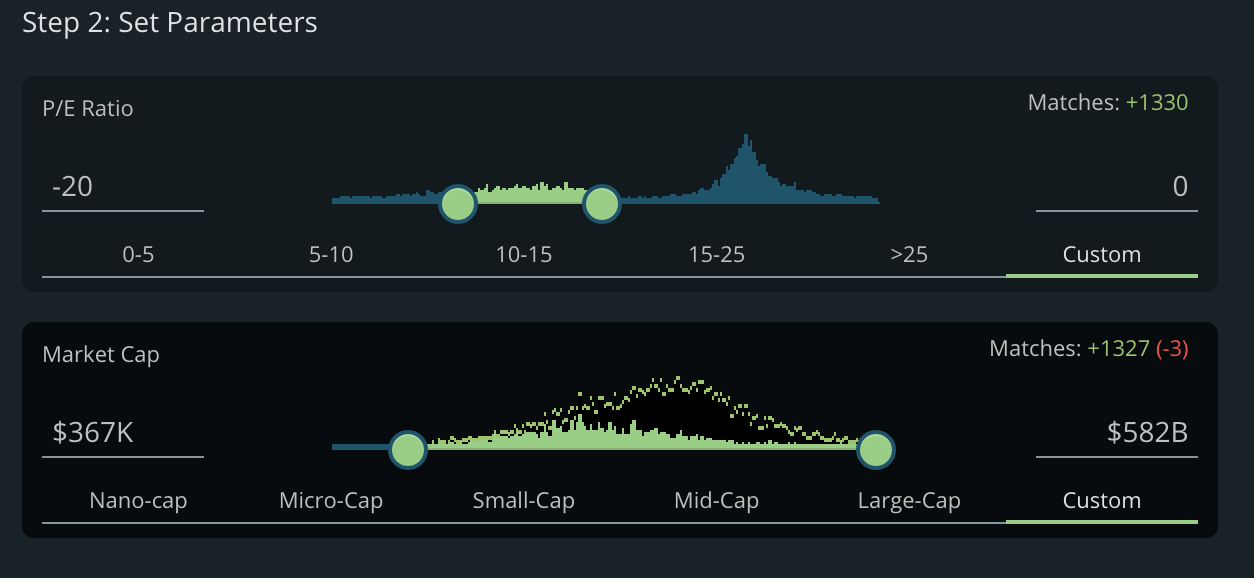
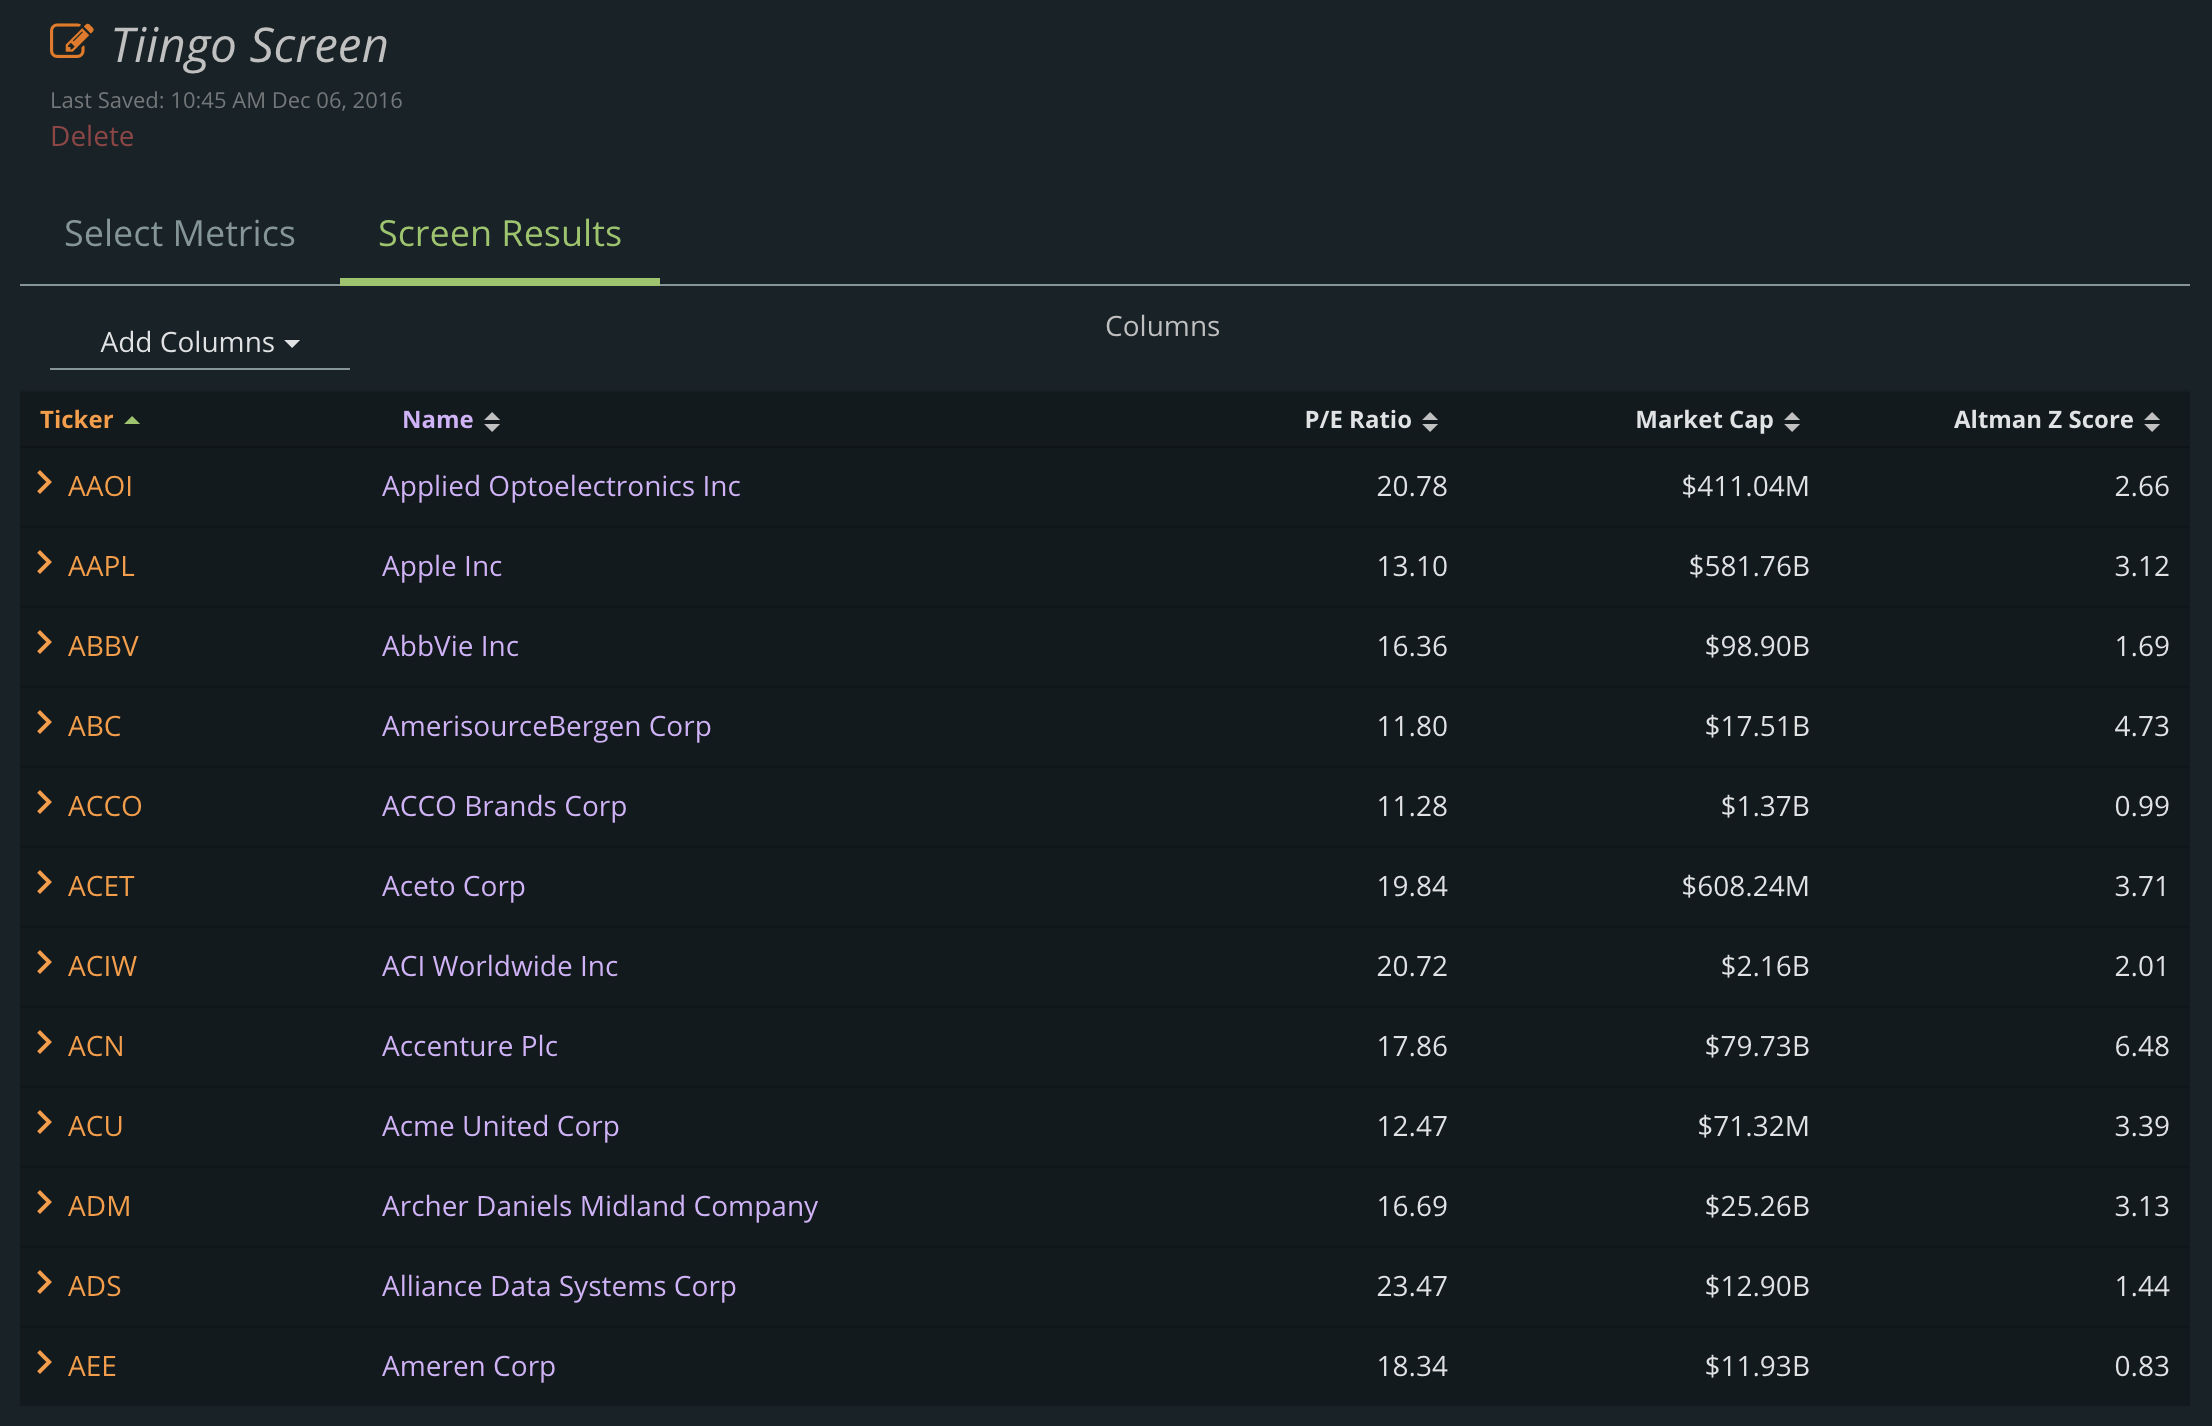
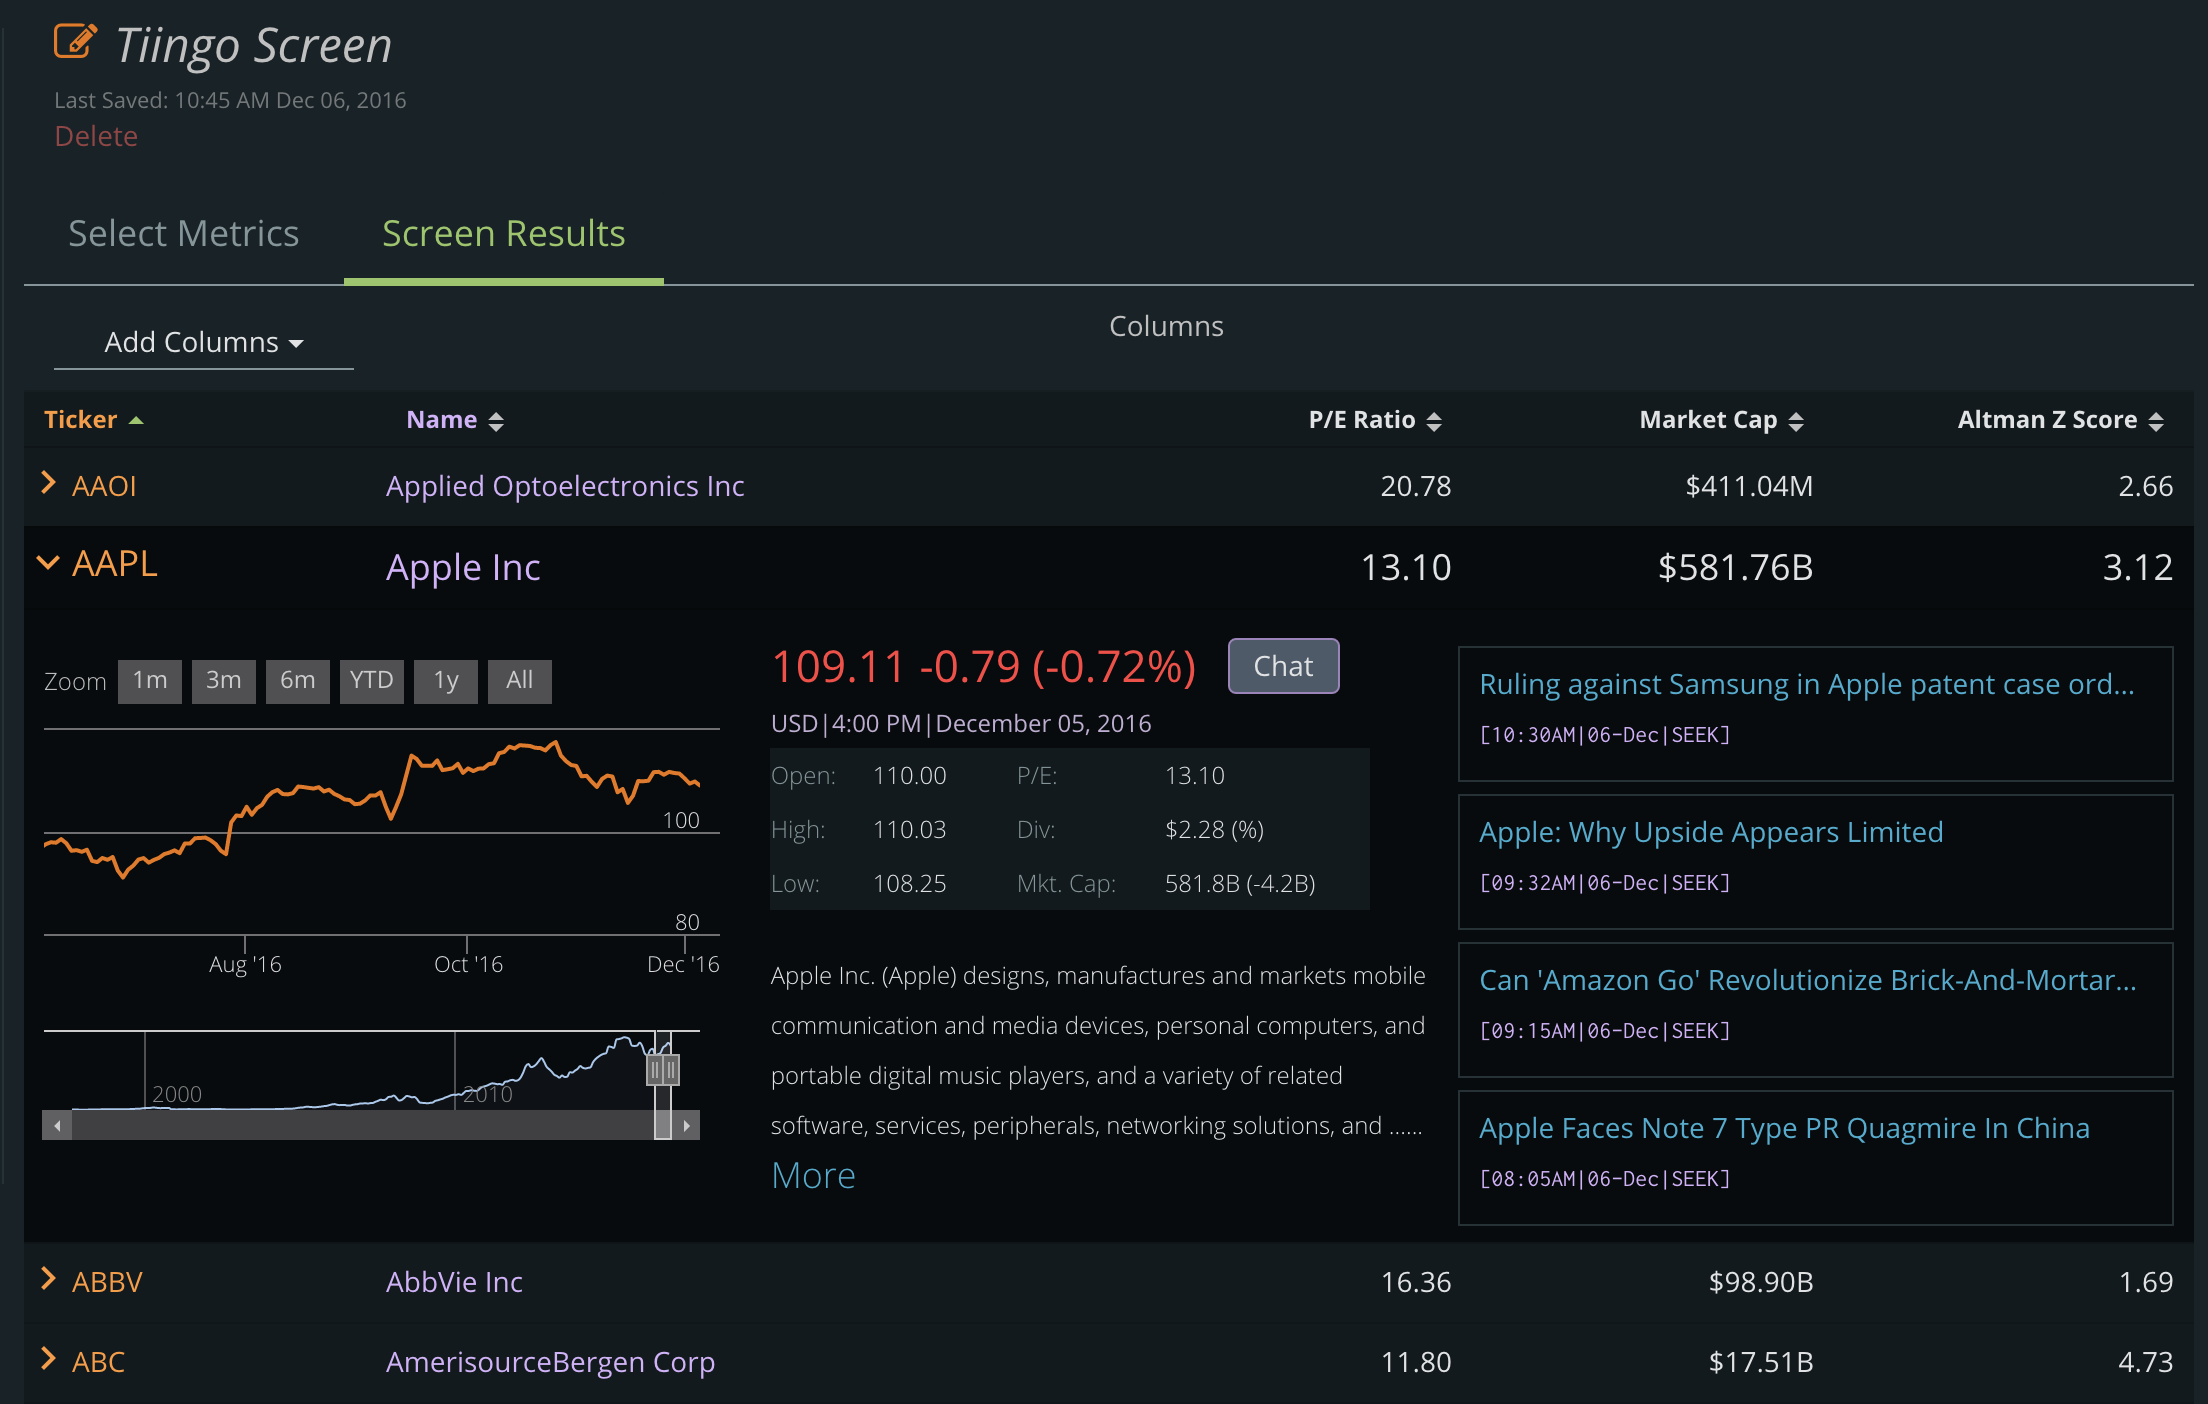
In addition to end of day equities prices, we have a multitude of premium data sets that can be made available on-chain through our Chainlink node to service the increasing DeFi demand. This includes over 70,000+ global securities (Stocks, ETFs, and Funds), 4,100+ crypto trading pairs, and 130+ FX tickers. For a deeper look into how Tiingo provides the highest quality data with a highly available API, refer to https://api.tiingo.com/.
“We’re thrilled to launch our own Chainlink node live on mainnet, providing us with a universal gateway to start supplying premium financial data to the fast growing DeFi industry. This allows us to facilitate the launch of new DeFi markets, applications, and products, starting first with support for on-chain U.S. equities markets via signed EOD equities prices directly from our API. We envision this is only the beginning of our long and fruitful expansion into DeFi through the Chainlink Network.” — Rishi Singh, CEO of Tiingo
About Chainlink
Chainlink is the most widely used and secure way to power universally connected smart contracts. With Chainlink, developers can connect any blockchain with high-quality data sources from other blockchains as well as real-world data. Managed by a global, decentralized community of hundreds of thousands of people, Chainlink is introducing a fairer model for contracts. Its network currently secures billions of dollars in value for smart contracts across the decentralized finance (DeFi), insurance and gaming ecosystems, among others.
Chainlink is trusted by hundreds of organizations to deliver definitive truth via secure, reliable data feeds. To learn more, visit chain.link, subscribe to the Chainlink newsletter, and follow @chainlink on Twitter.
Docs | Discord | Reddit | YouTube | Telegram | Events | GitHub | Price Feeds | DeFi | VRF
About Tiingo
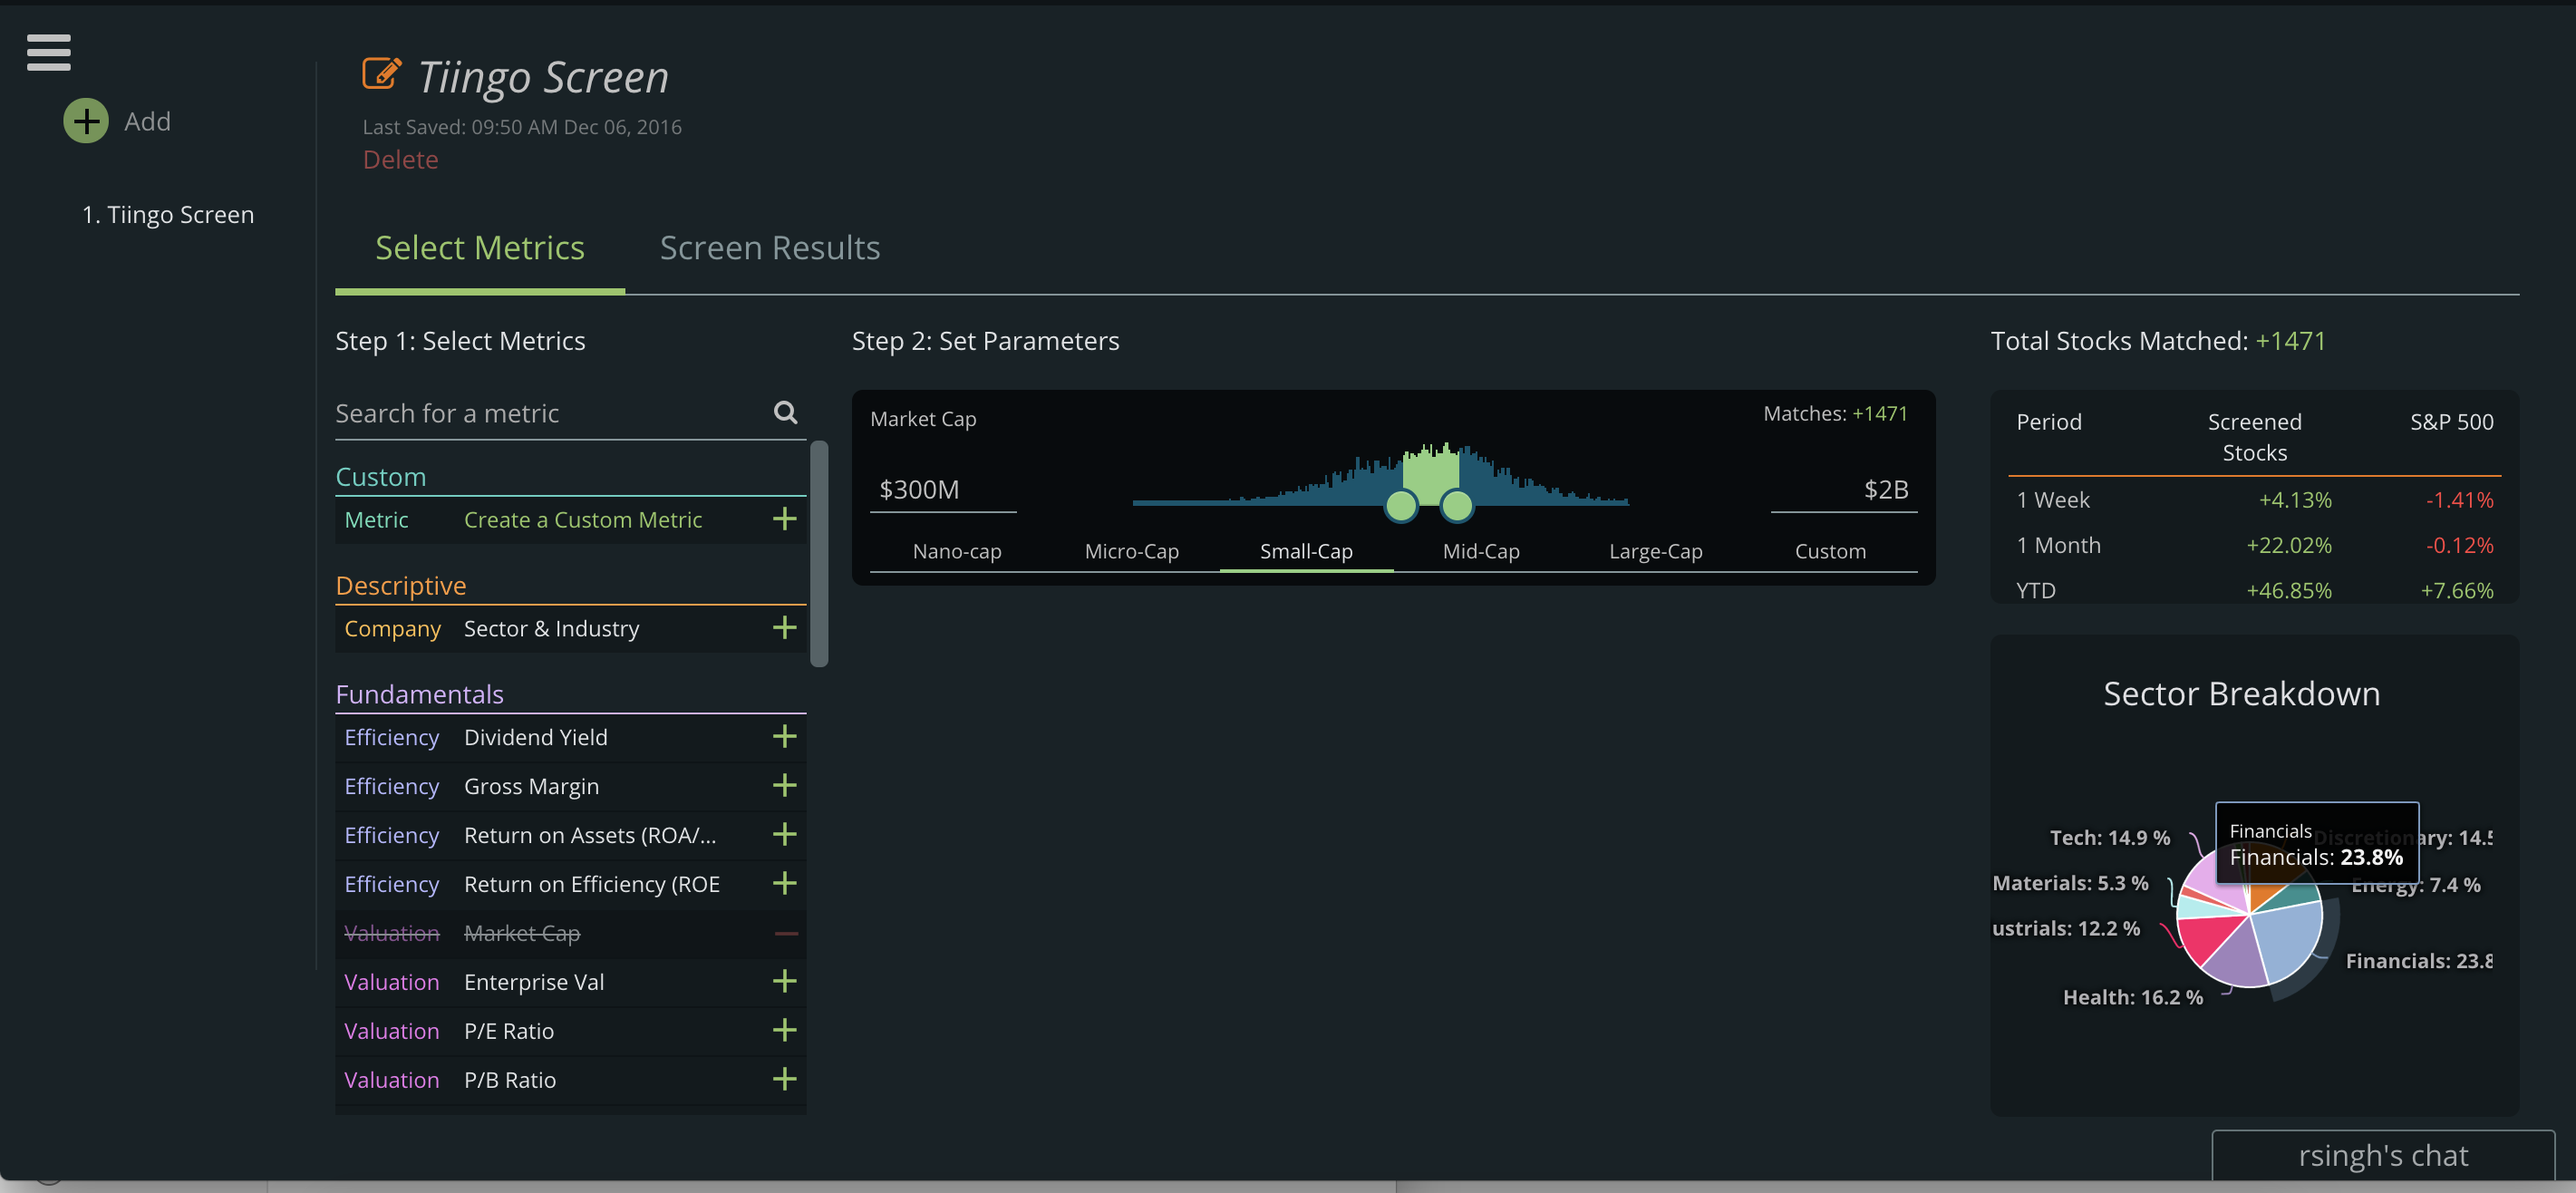
Tiingo is an award-winning financial analytics and data platform that powers thousands of asset managers, technology firms, and individuals across the globe. Unique in its position as both a consumer of its data and distributor, Tiingo is trusted by firms across the industry for its clean and unique datasets, which are engineered for the discovery of new alpha sources. With a mission deeply rooted in democratizing access to financial analytics and data, Tiingo is also a leader in financial education for future generations, having partnered with research departments at universities across the world to advocate for financial markets literacy.
Formed in 2014, Tiingo holds that belief that love is the ideal way to conduct business. We are a team made up of artists, engineers, and algorithmic hedge fund traders. Some of us have been professional photographers, and others have created trading algos managing hundreds of millions of dollars. We are united with the same goal: to make everyone’s life easier in the ways we know how.
To learn more about Tiingo’s APIs visit https://api.tiingo.com and to learn more about the Tiingo analytics engine, visit https://www.tiingo.com.