We’re excited to announce that Tiingo has launched our own Chainlink node live on mainnet, bringing our financial market data directly to blockchain markets. Our initial journey will start with providing cryptographically signed end-of-day equities price data directly on-chain, with several DeFi applications already set to consume it. This enables a whole host of new DeFi markets to exist, specifically built around U.S. equities, such as perpetual derivatives contracts, synthetic assets, rebasing tokens, and more.
Being the most widely used oracle solution in the market, Chainlink was the clear choice in blockchain middleware necessary to get our existing API’s blockchain enabled across all the leading networks. Not only does the Chainlink node allow us to sell our API data directly to various blockchain applications, but we can sign our data on-chain to prove its origin as being from Tiingo, further adding to its reliability when settling DeFi contracts. Additionally, the node setup process was very easy and seamless, requiring minimal technical effort to get our API data exposed to a much wider range of markets.
In addition to end of day equities prices, we have a multitude of premium data sets that can be made available on-chain through our Chainlink node to service the increasing DeFi demand. This includes over 70,000+ global securities (Stocks, ETFs, and Funds), 4,100+ crypto trading pairs, and 130+ FX tickers. For a deeper look into how Tiingo provides the highest quality data with a highly available API, refer to https://api.tiingo.com/.
“We’re thrilled to launch our own Chainlink node live on mainnet, providing us with a universal gateway to start supplying premium financial data to the fast growing DeFi industry. This allows us to facilitate the launch of new DeFi markets, applications, and products, starting first with support for on-chain U.S. equities markets via signed EOD equities prices directly from our API. We envision this is only the beginning of our long and fruitful expansion into DeFi through the Chainlink Network.” — Rishi Singh, CEO of Tiingo
About Chainlink
Chainlink is the most widely used and secure way to power universally connected smart contracts. With Chainlink, developers can connect any blockchain with high-quality data sources from other blockchains as well as real-world data. Managed by a global, decentralized community of hundreds of thousands of people, Chainlink is introducing a fairer model for contracts. Its network currently secures billions of dollars in value for smart contracts across the decentralized finance (DeFi), insurance and gaming ecosystems, among others.
Chainlink is trusted by hundreds of organizations to deliver definitive truth via secure, reliable data feeds. To learn more, visit chain.link, subscribe to the Chainlink newsletter, and follow @chainlink on Twitter.
Tiingo is an award-winning financial analytics and data platform that powers thousands of asset managers, technology firms, and individuals across the globe. Unique in its position as both a consumer of its data and distributor, Tiingo is trusted by firms across the industry for its clean and unique datasets, which are engineered for the discovery of new alpha sources. With a mission deeply rooted in democratizing access to financial analytics and data, Tiingo is also a leader in financial education for future generations, having partnered with research departments at universities across the world to advocate for financial markets literacy.
Formed in 2014, Tiingo holds that belief that love is the ideal way to conduct business. We are a team made up of artists, engineers, and algorithmic hedge fund traders. Some of us have been professional photographers, and others have created trading algos managing hundreds of millions of dollars. We are united with the same goal: to make everyone’s life easier in the ways we know how.
Tiingo is excited to announce that we will be bringing our premium API data to leading blockchain networks via the launch of our own official Chainlink oracle node! As part of the market-leading Chainlink Network, which connects blockchain applications (built using smart contracts) to external data APIs, we will be able get our entire suite of APIs blockchain-enabled, allowing us to supply smart contract developers with a wide variety of financial datasets used to trigger their execution.
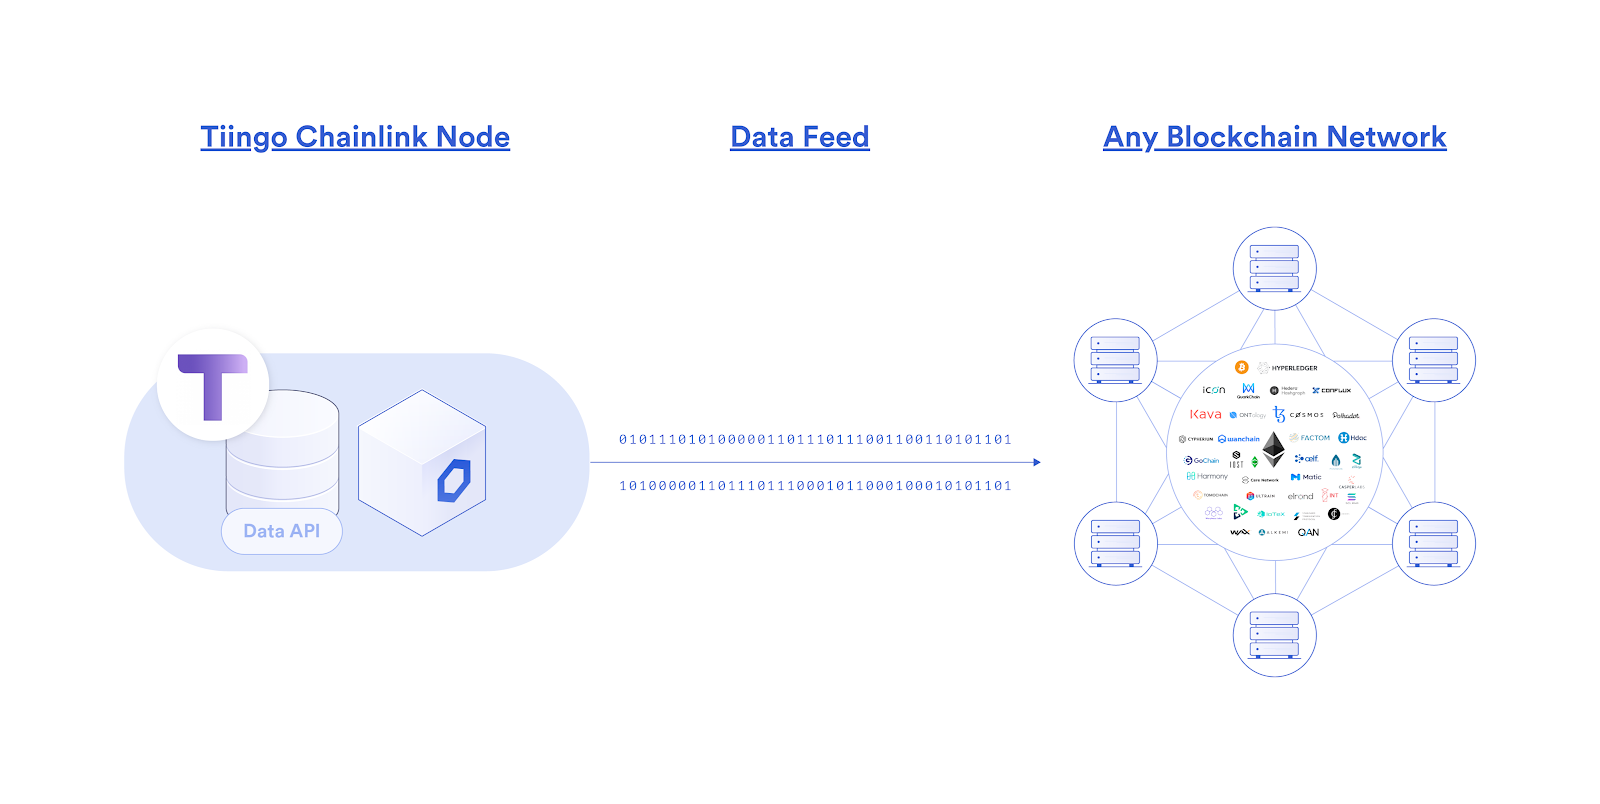
Given the emergence of Decentralized Finance (DeFi), an ecosystem of financial applications and products built on blockchains, we see a great opportunity to make our data available across the DeFi market via our Chainlink oracle node. Through the Tiingo Chainlink oracle node, we can broadcast our API data directly onto any blockchain platform, as well as sign that data on-chain through a unique cryptographic signature to prove its origin as being from Tiingo. Not only will this grow our reach as a data provider into new blockchain-based markets, but our data can expand the types of DeFi applications that can be built, ultimately empowering us to directly support and participate in the provisioning of a completely new and parallel financial system.
Our initial focus will be providing on-chain data regarding the closing prices of equities, before then moving our attention to developing FX feeds. This will enable DeFi developers to build on-chain financial products such as derivatives based on traditional equities, further widening the types of financial exposure users can get within DeFi markets.
Establishing Tiingo as a Top Oracle Node and DeFi Data Provider
Tiingo consists of a data research and analytics arm, a news aggregator, and a professional suite of APIs. Our API provides over 1,253,400,491 data points and counting, including price tickers for over 70,000+ global securities (stocks, ETFs, and Mutual Funds), 4,100+ crypto tickers, and 40+ FX tickers. We also have over 30 million financially tagged news articles (Equities, Funds, Crypto, and FX), and provide fundamental data on stocks and ETFs, which include 106 Indicators, 20+ Years of Fundamental History, Quarterly and Annual Data, and Restatements and As-Reported Numbers.
Our stock price API in particular is made up of at least 3 data sources on average for each price feed, protecting users against downtime and erroneous data points. We’ve implemented a proprietary data cleaning framework that allows us to quickly monitor any erroneous points and apply fixes, accompanied by a full audit trail to reproduce the price series. Our prices are also highly precise as we don’t round to only include a few decimal places, and our uptime is high, with optimized in-memory caching, and proprietary disk caching so we can deliver data quickly and consistently.
With a wide selection of high-quality market data, we are ready to begin our journey into the blockchain markets by supplying it directly to smart contract developers and applications, where it can be used to execute key on-chain functions like settling a derivatives contract, triggering automated on-chain trading strategies, calculating fine-tuned loan rates based on historical data, and more.
However, due to the inherent security properties of the blockchain, smart contract applications are unable to natively interact with external APIs, creating what is known as the oracle problem. In order to overcome this, we required an additional piece of infrastructure known as a blockchain oracle, which can deliver external data from our API to blockchain-based smart contracts in a secure, reliable, and properly formatted manner.
Upon examining various solutions, we found Chainlink to offer the most time-tested and battle hardened oracle solution, along with a large and growing network effect of data providers and blockchain applications already supplying and consuming data through it. Some of the key features we found unique to the Chainlink Network include:
Data Quality – Through our Chainlink node, we can cryptographically sign each data point we broadcast on the blockchain, preventing man-in-the middle attacks by proving to users the origin of our data.
Blockchain Agnostic – Chainlink nodes can integrate into any blockchain network, serving as a single gateway for supplying and/or selling data to any current and future blockchain.
Network Effect – Chainlink is the most widely used oracle network in DeFi and already secures billions of dollars in value for blockchain applications, meaning there is a large consumer base already built up and growing.
Trusted Infrastructure – Chainlink is thoroughly audited open-source software built upon strong academic research and maintained by a large and growing developer community, ensuring high levels of security and reliability.
We look forward to using Chainlink to bring our world class APIs to blockchain developers around the world, empowering them to build more advanced and unique DeFi applications supported by high-quality, cryptographically secure financial data. We’re confident that we can become established as a leading Chainlink oracle node for financial market data by bringing our experience and expertise into this new and largely untapped DeFi market.
“As a team focused on delivering data solutions to the ever-expanding data-driven economy, we were extremely excited at the opportunity to make our API data available across the leading blockchains via the Chainlink Network,” stated Rishi Singh, CEO of Tiingo. “By running our own Chainlink node, we can now actively participate in provisioning a new wave of applications and services that bring freedom and equity to users around the world by ensuring that those data-driven products are triggered by accurate, transparent data feeds in a highly reliable manner.”
About the Chainlink Network
Chainlink is the most widely used and secure way to power universal smart contracts. With Chainlink, developers can connect any blockchain with high-quality data sources from other blockchains and real-world data. Managed by a global, decentralized community of hundreds of thousands of people, Chainlink introduces a fairer model for contracts. Its network currently secures billions of dollars in value for smart contracts across the decentralized finance (DeFi), insurance and gaming ecosystems, among others.
Chainlink is trusted by hundreds of organizations to deliver definitive truth via secure, reliable data feeds. To learn more, visit chain.link, subscribe to the Chainlink newsletter, and follow @chainlink on Twitter.
Tiingo is an award-winning financial analytics and data platform that powers thousands of asset managers, technology firms, and individuals across the globe. Unique in its position as both a consumer of its data and distributer, Tiingo is trusted by firms across the industry for its clean and unique datasets, which are engineered for the discovery of new alpha sources. With a mission deeply rooted in democratizing access to financial analytics and data, Tiingo is also a leader in financial education for future generations, having partnered with research departments at universities across the world to advocate for financial markets literacy.
Formed in 2014, Tiingo holds that belief that love is the ideal way to conduct business. We are a team made up of artists, engineers, and algorithmic hedge fund traders. Some of us have been professional photographers, and others have created trading algos managing hundreds of millions of dollars. We are united with the same goal: to make everyone’s life easier in the ways we know how.
For the past seven months, we’ve been rebuilding Tiingo.com. As a result, we’ve upgraded Tiingo.com – including the entire front-end engine, as well as much of the back-end. Every line of code was reconstructed with a focus on performance, while also incorporating your feedback, and knocking things off our wishlist that will let us develop features faster for you.
Check out the below for a thorough explanation of what we did – or visit Tiingo.com to experience the changes right away.
Enjoy!
Announcing Tiingo Version 2
Our goal for the below will be to show the visual result as well as share some of the reasoning behind those decisions.
It makes me happy and excited to see the new features and layout, and I hope the below will show you how much care we took to make this new version consistent with our values.
Color Scheme and Organization
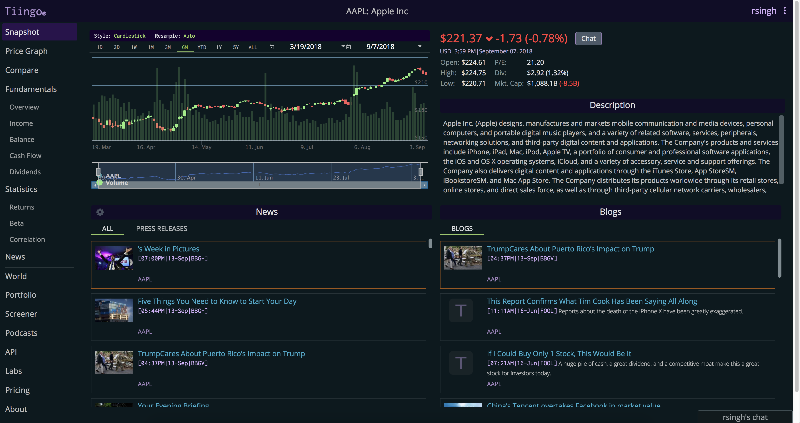
Our UI was rebuilt to help focus the eyes onto relevant pieces of information you may be looking for. Additionally, the colors and format were rebuilt to make consistency a priority. This will allow you to match functionality with colors.
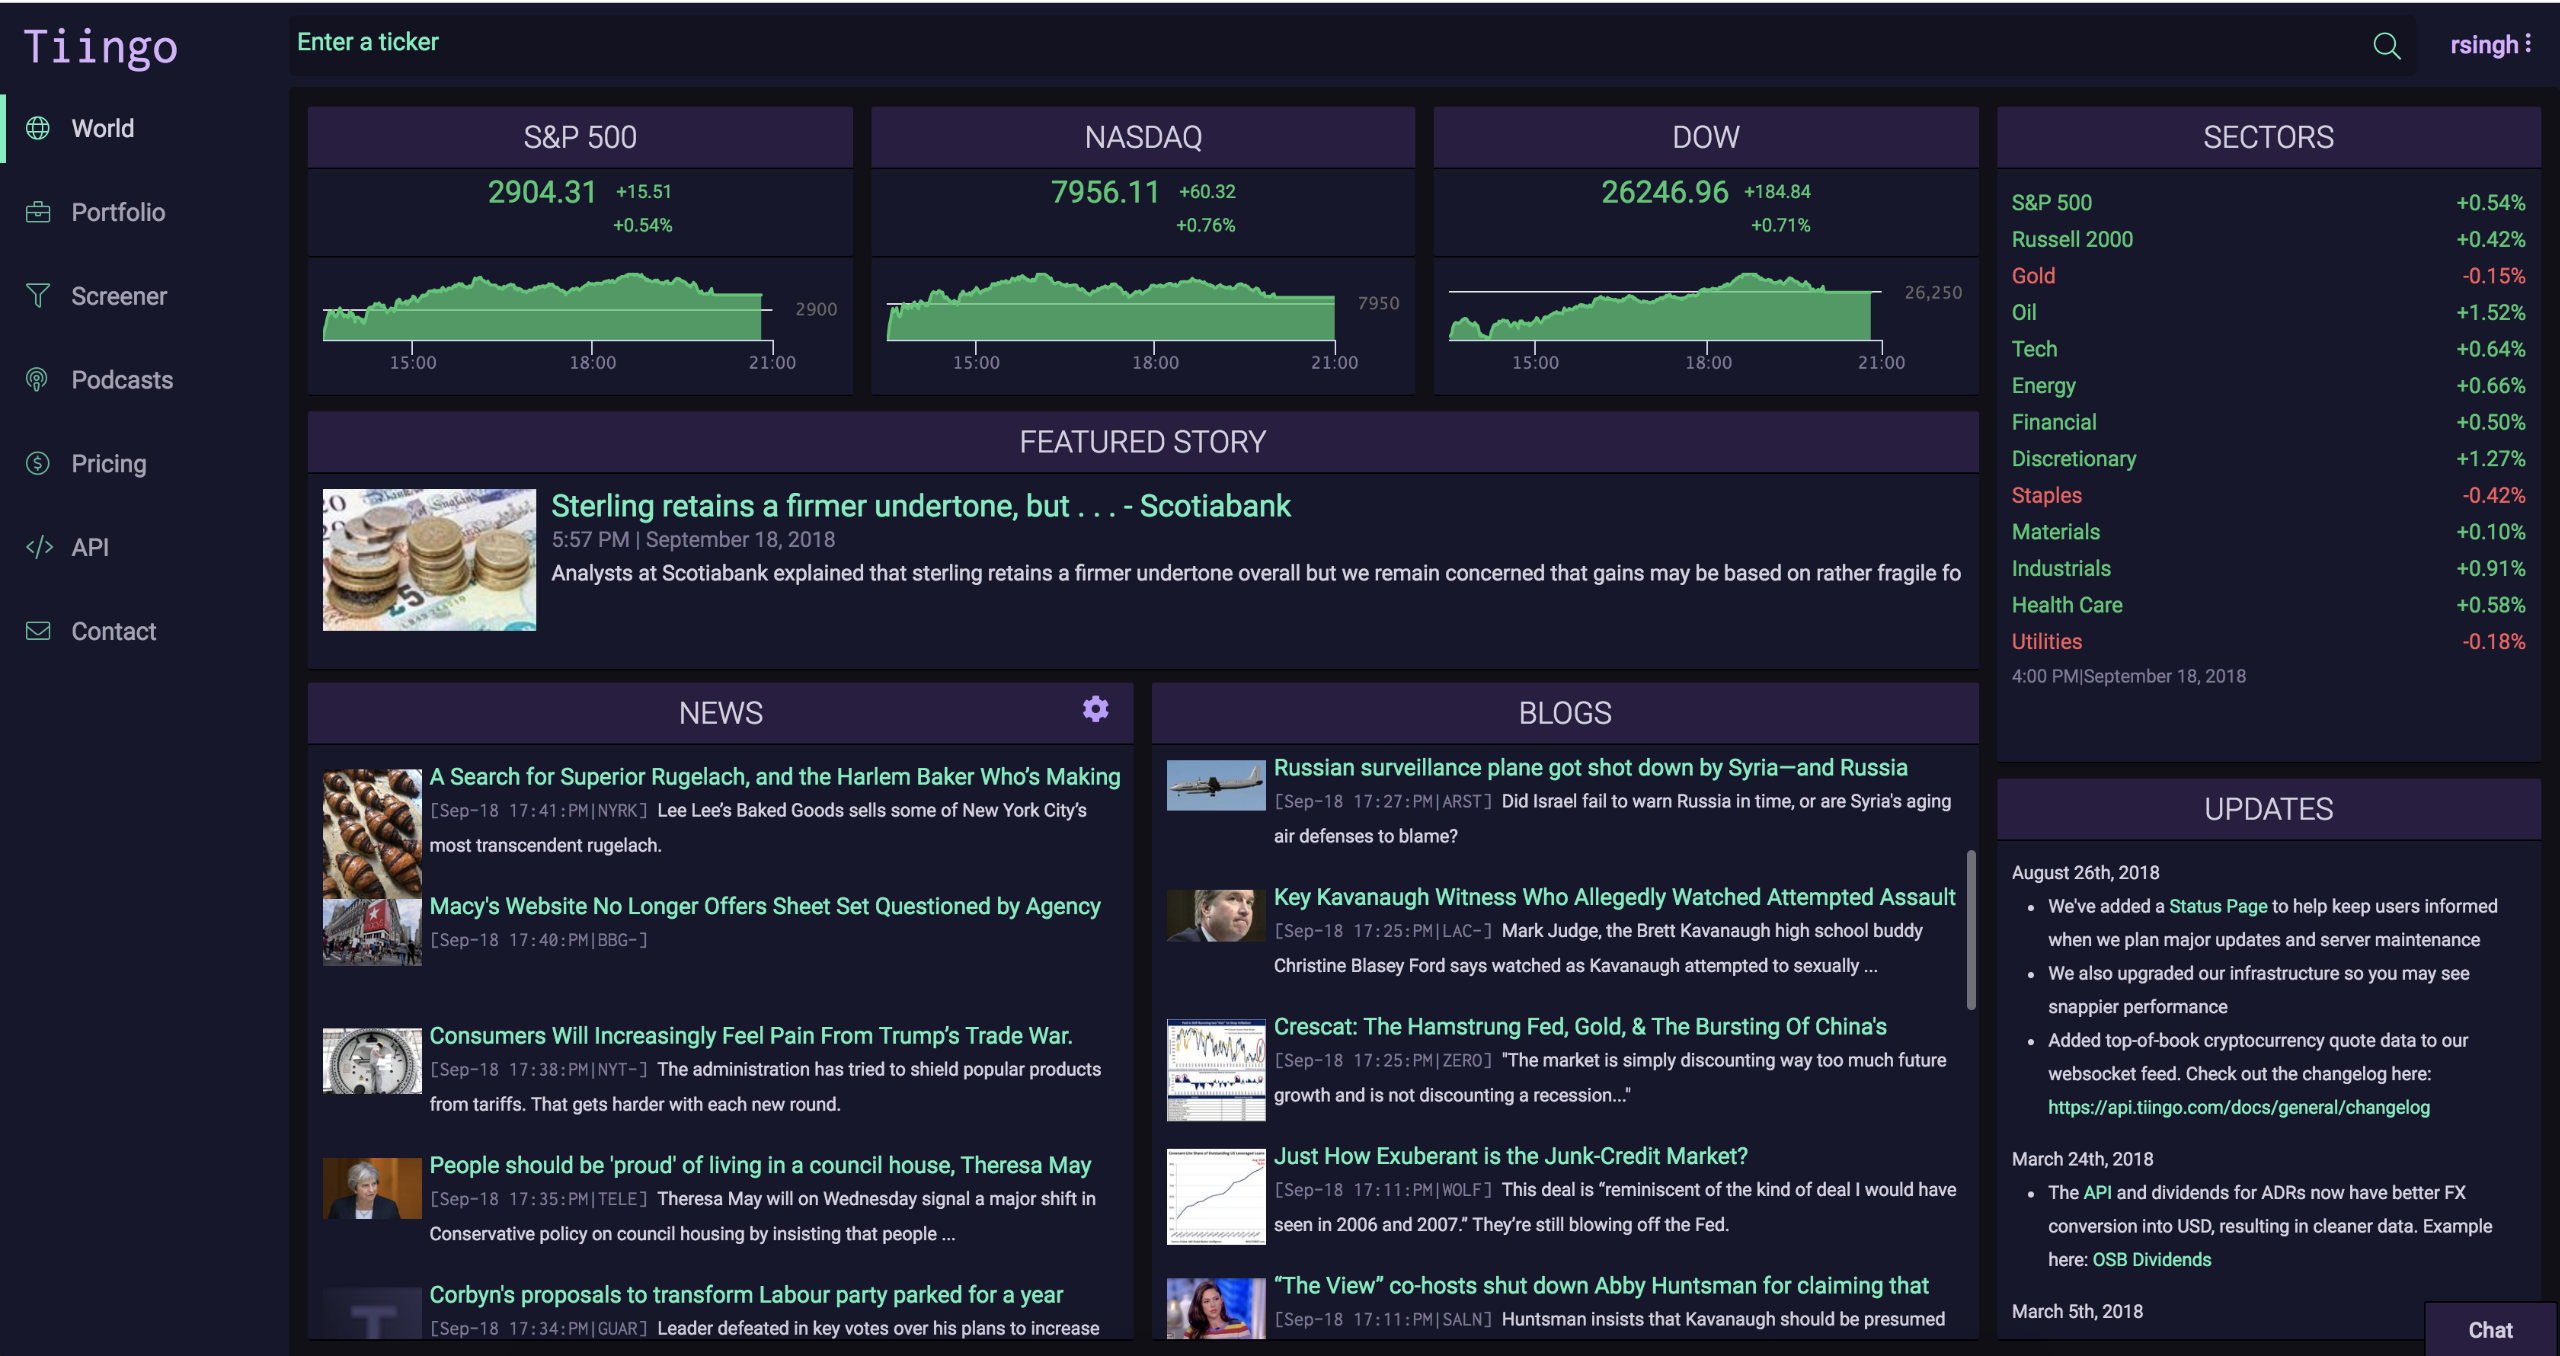
Here is a zoomed out picture:
You will now see each segment of information contains a header, and the body of the segment has a separate background. These are a few visual techniques to keep the information clean and separated.
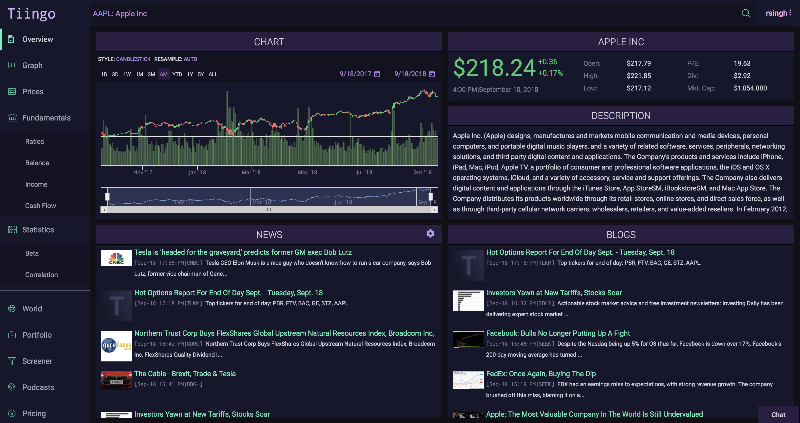
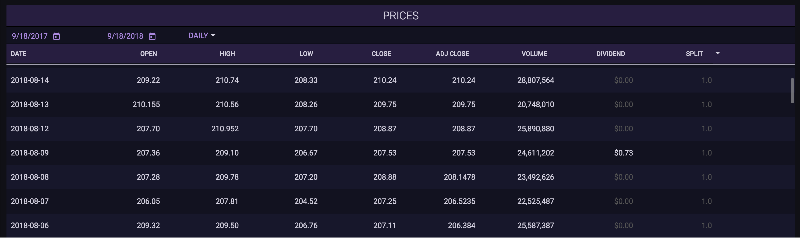
The most obvious example of this is on a stock’s overview page. The first image is the new UI (V2) and the second picture is the old UI.
None of the changes we’ve made are to keep you on the pages longer. In fact, we hope your eyes follow the information you’re looking for and therefore let you navigate through the data even faster.
These are just two small examples of the considerations that went into the redesign. You will find many of these types of changes all over the new Tiingo.com
User Experience
We incorporated a number of features based on your suggestions that make your workflow easier.
For example, now when you look up the fundamentals for a particular stock, then change the stock in the top bar, we keep you on the same page. This means if you have gotten the fundamental data configured for a few particular dates, then you change the ticker, we keep your configuration options the same and pull data for those dates for the new ticker.
This makes comparing data across dates much quicker.
We learned that many of you keep multiple portfolios and run different analysis on each one. So we made Portfolio selection a much easier process. Now you can easily click between portfolios on the left-hand bar and compare stats across each one through a single click.
Throughout the entire platform you will notice a massive speed boost. We rebuilt our entire codebase from the ground up and also migrated from AngularJS to Angular 6
These are just a few changes we made that will make your experience better. As you use Tiingo, you will find more of these improvements.
New Features
While this UI update was primarily focused on migrating existing functionality, we added a couple new features throughout Tiingo. Here are two of them:
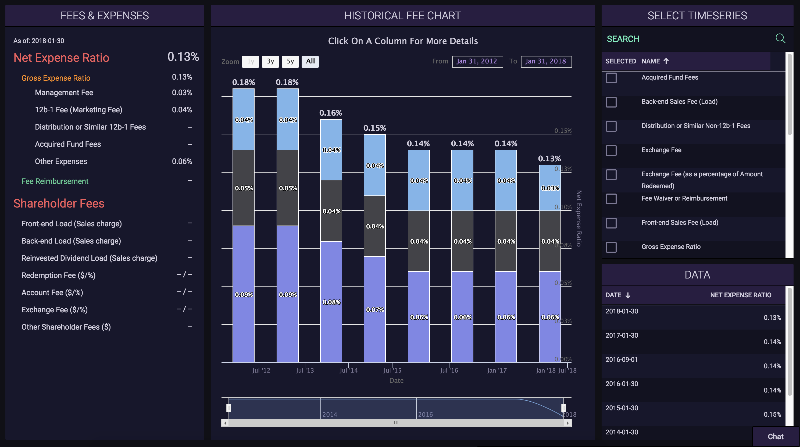
For ETFs and Mutual Funds we created a better way to see graphs of how fee expenses have changed over time. Our goal is to highlight when companies are doing something funny with their fees and also to spot trends over time.
We’ve added small tweaks and new features all over the site. For example, you can now view your API usage and token on Tiingo.com in addition to the API, and we also changed the way you graph fundamentals to make it easier to compare values. Visit Tiingo.com to see all of the changes.
Thank You
Thank you all for being such wonderful users. We look forward toward our continued growth into 2019 and we know this can only happen with a firm foundation: a kind and growing userbase, a firm technical footing, and a happy, loving team.
All the best,
The Tiingo Team
Making the World’s Best Screener for Our Users Pt. 2
As we’ve improved our screener- we also couldn’t stand idly by not updating our custom metrics creator. Tiingo was the first major financial tech company to allow any user to create their own stock screening metric.
And as time passed – we realized we were going to make it so much better for you.
Announcing: The Sexy, Newly Revamped Custom Metrics Creator:
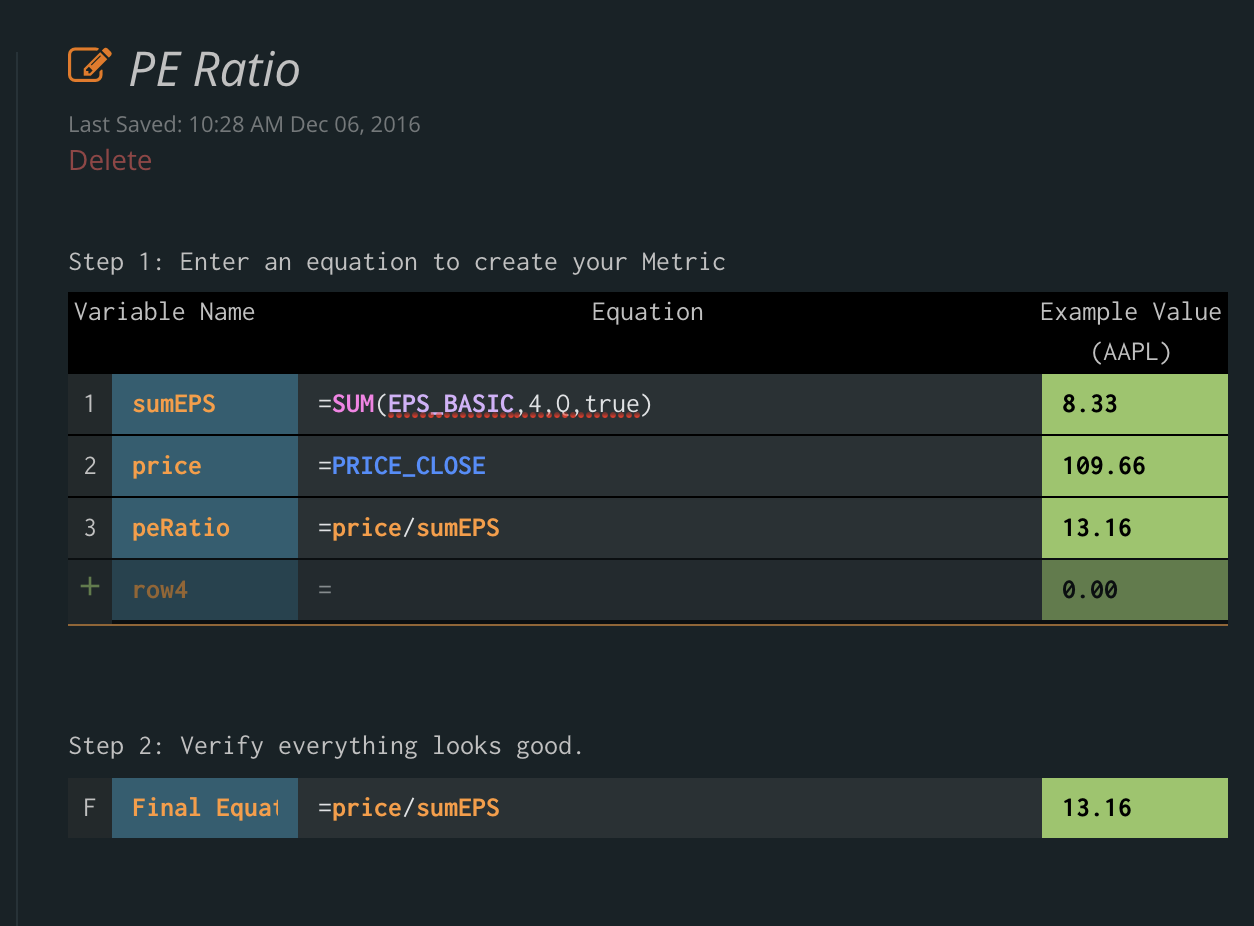
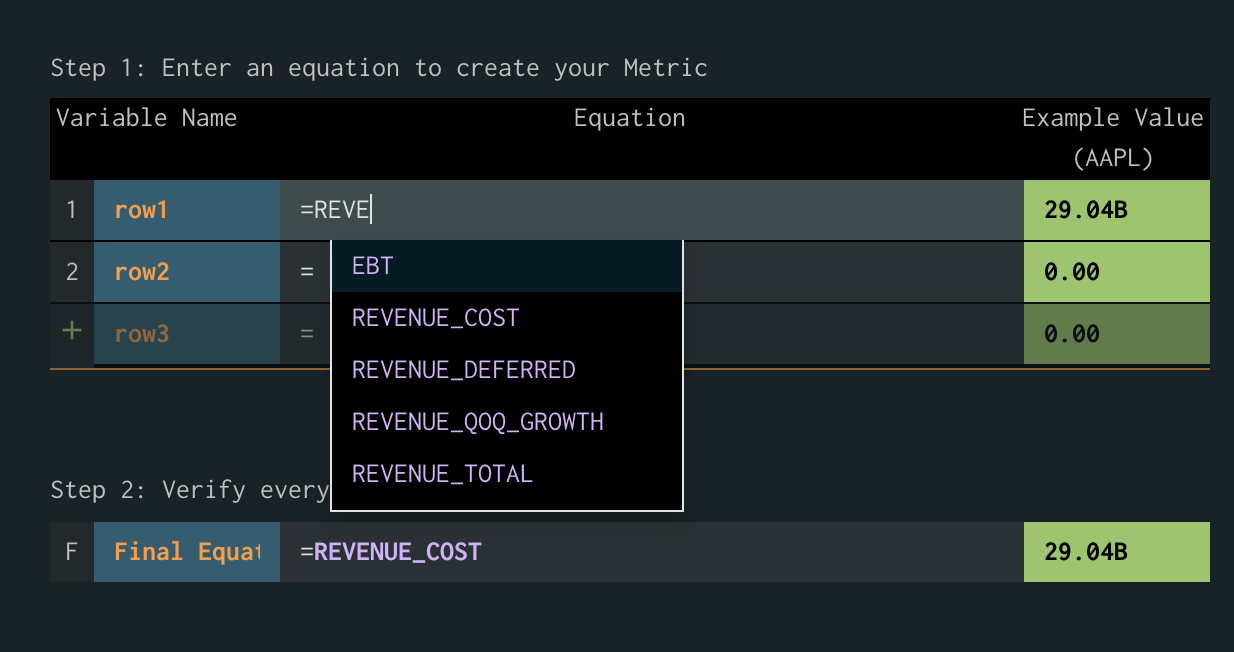
The New “IDE”
Programmers use “IDE”s to code – and we wanted to make that simple for everybody to use. We created our own version that makes it so simple – so if you know Excel, you know how to make a custom metric.
And the best part? Each line will give you the number calculated so you get feedback immediately.
We even added autocomplete:
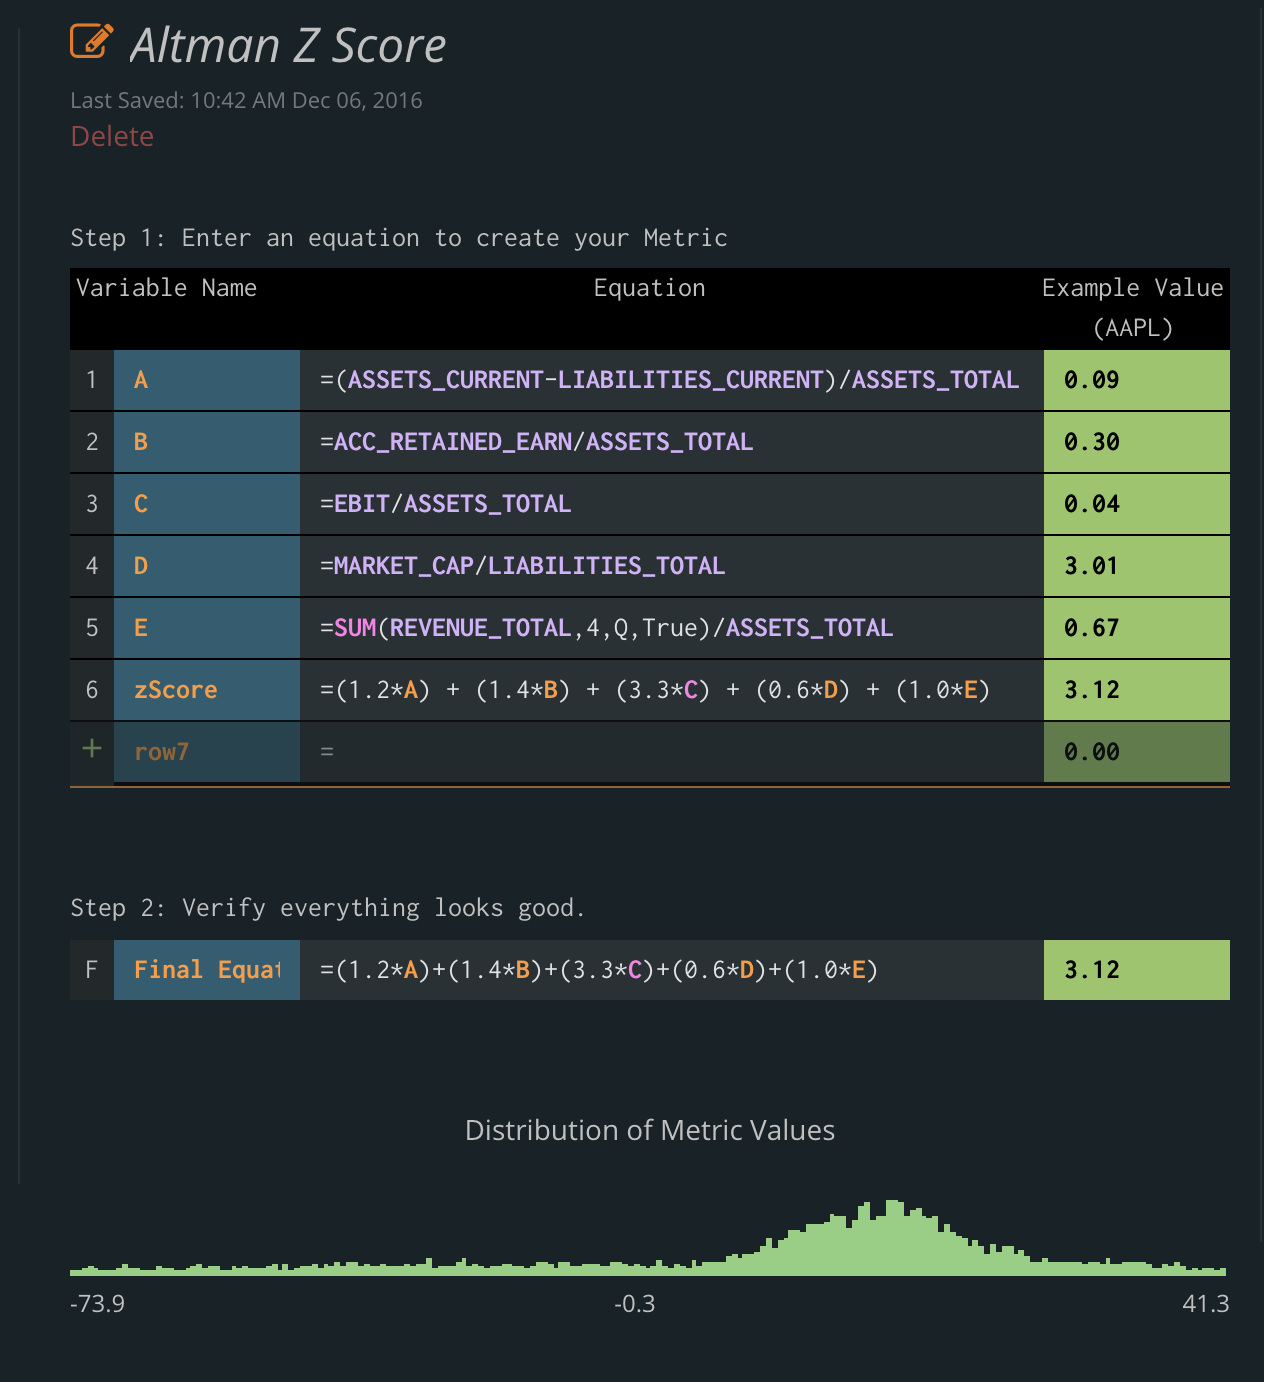
The Shifting Distribution
One of the most impressive features we’ve ever coded on Tiingo is taking your custom metric, and then calculating analytics on it immediately. The horse power this took was incredible and it pushed our coding abilities. Coding the shifting distributions, especially with custom metrics, took us 80% of our time.
As you enter your metric, you will see the distribution of your metric across the entire Tiingo Universe:
And now when you screen – just like the screener, the distribution of your metric will shift
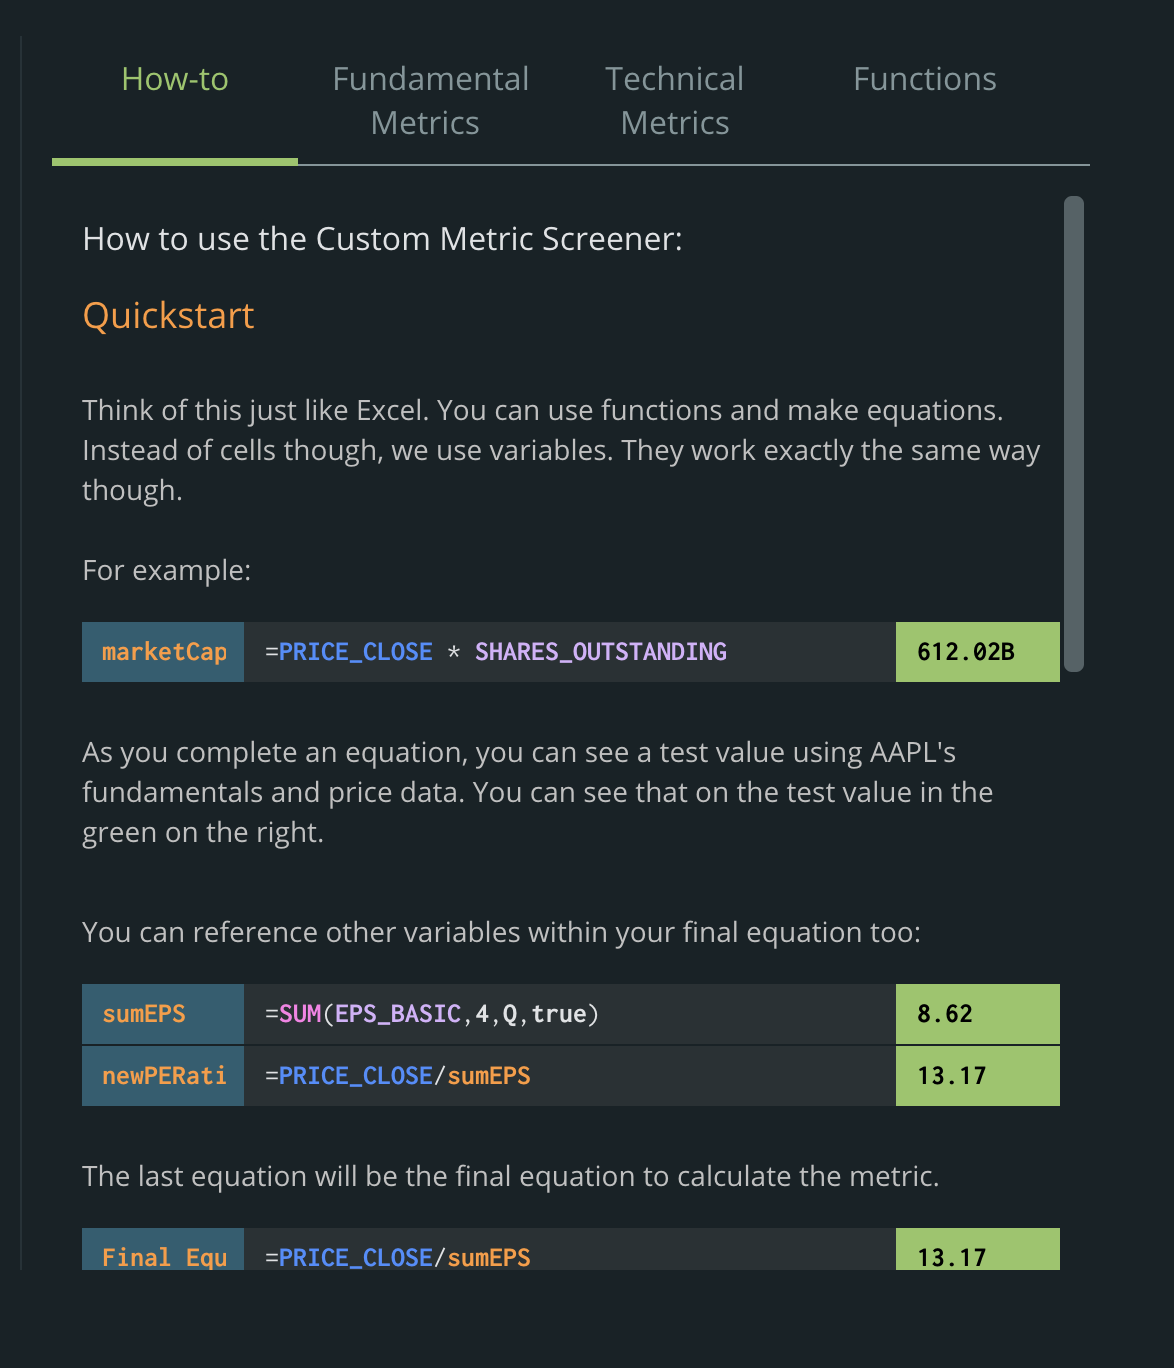
The Docs
This blog post couldn’t cover all of the metric and functions (like calculating the mean EPS over the past two years), so we created comprehensive documentation that let’s you harness the full power of the new screener
It is over a year ago Tiingo launched it’s first screener. We were attempting to move forward the power of screeners, and we had a grandiose ideas of how to do it. We were the first to:
Allow users to create their own metrics
Created a new UI that challenged existing assumptions of screeners
We’re never happy with the status quo, so we decided to challenge ourselves further. We were going to make the custom metrics more intuitive, the screener more informative, and the user experience so intuituve – you would have no idea that you just screened through ten million datapoints because it took 200ms.
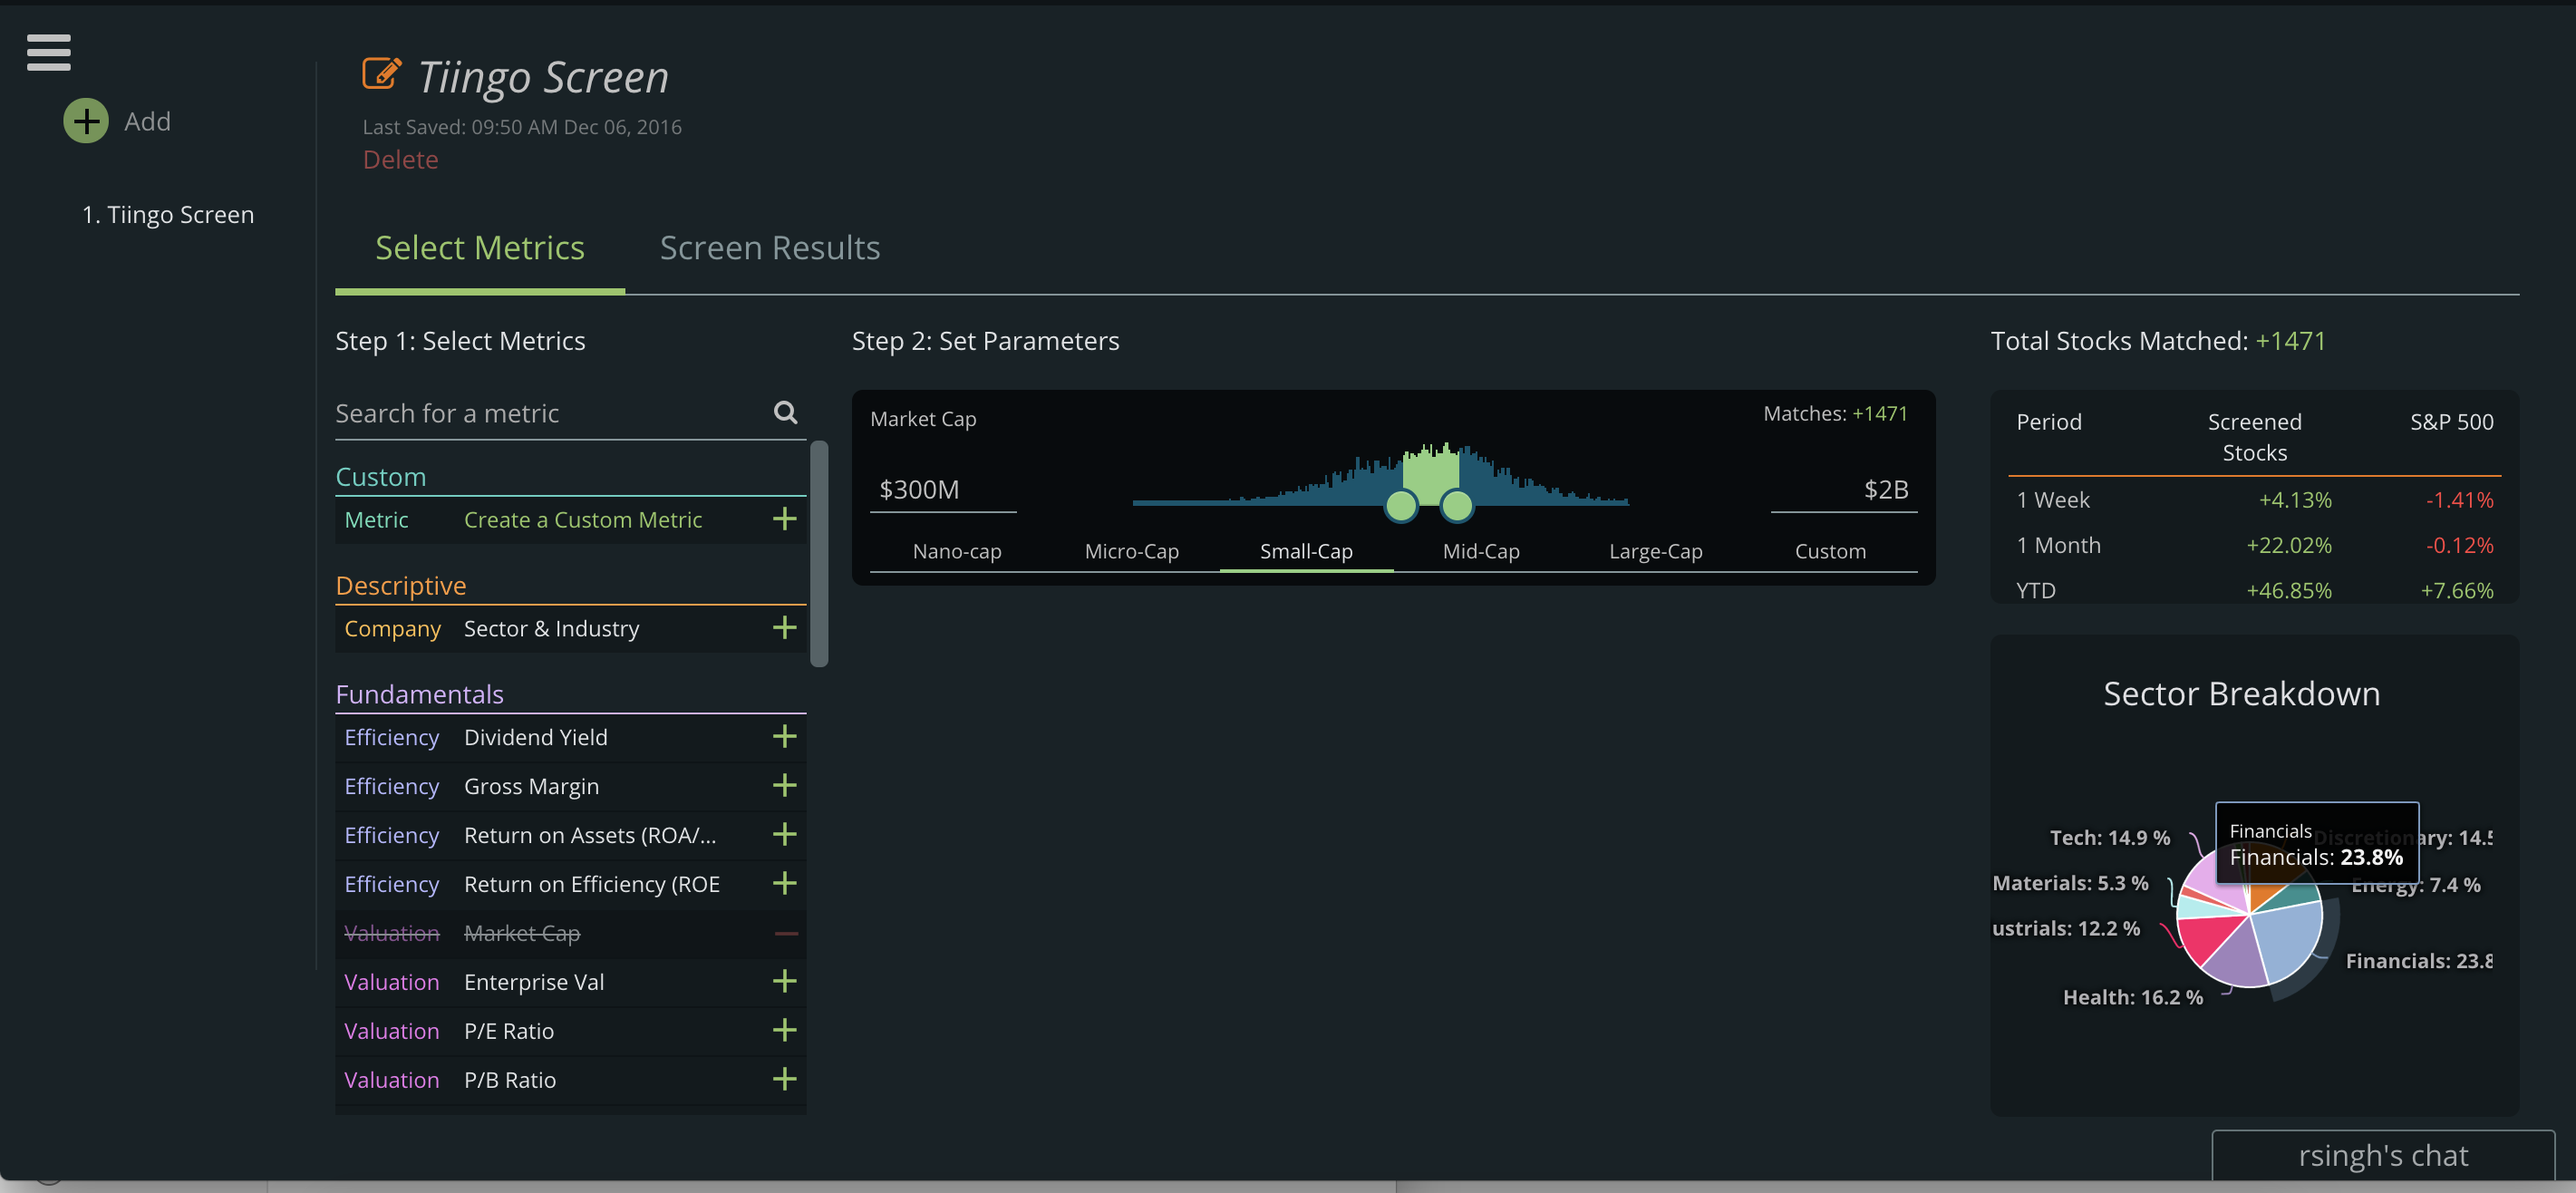
We’ve consolidated the screener overview page into a notebook format. This allows for easy switching among screens and reduces clutter while saving you clicks. We strive for beautiful minimalism here at Tiingo:
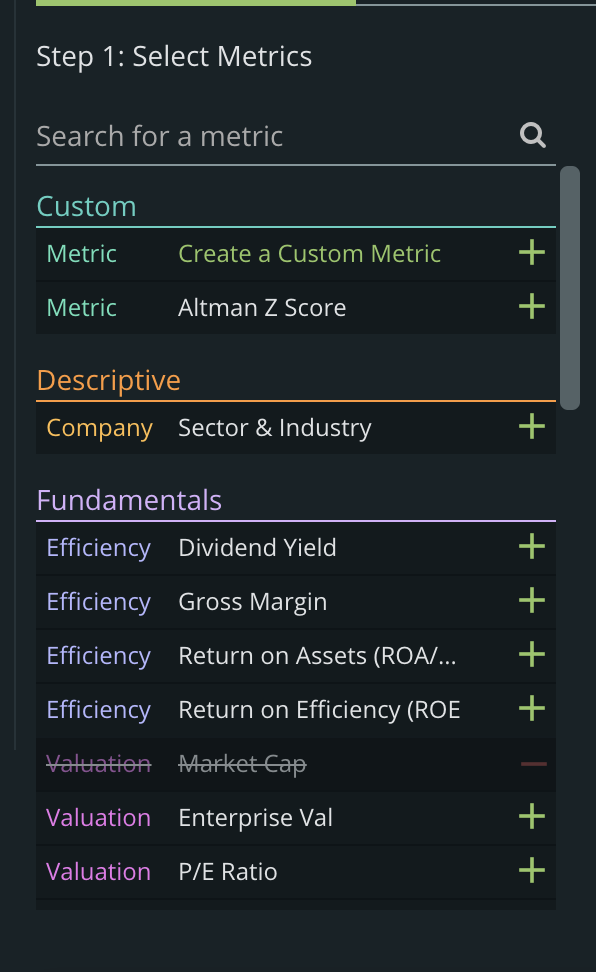
Searchable Filters
While the old drag and drop was nice, we wanted to come up with a new way to add/remove filters. We’ve created a beautiful searchable table, organized by the type of metric.
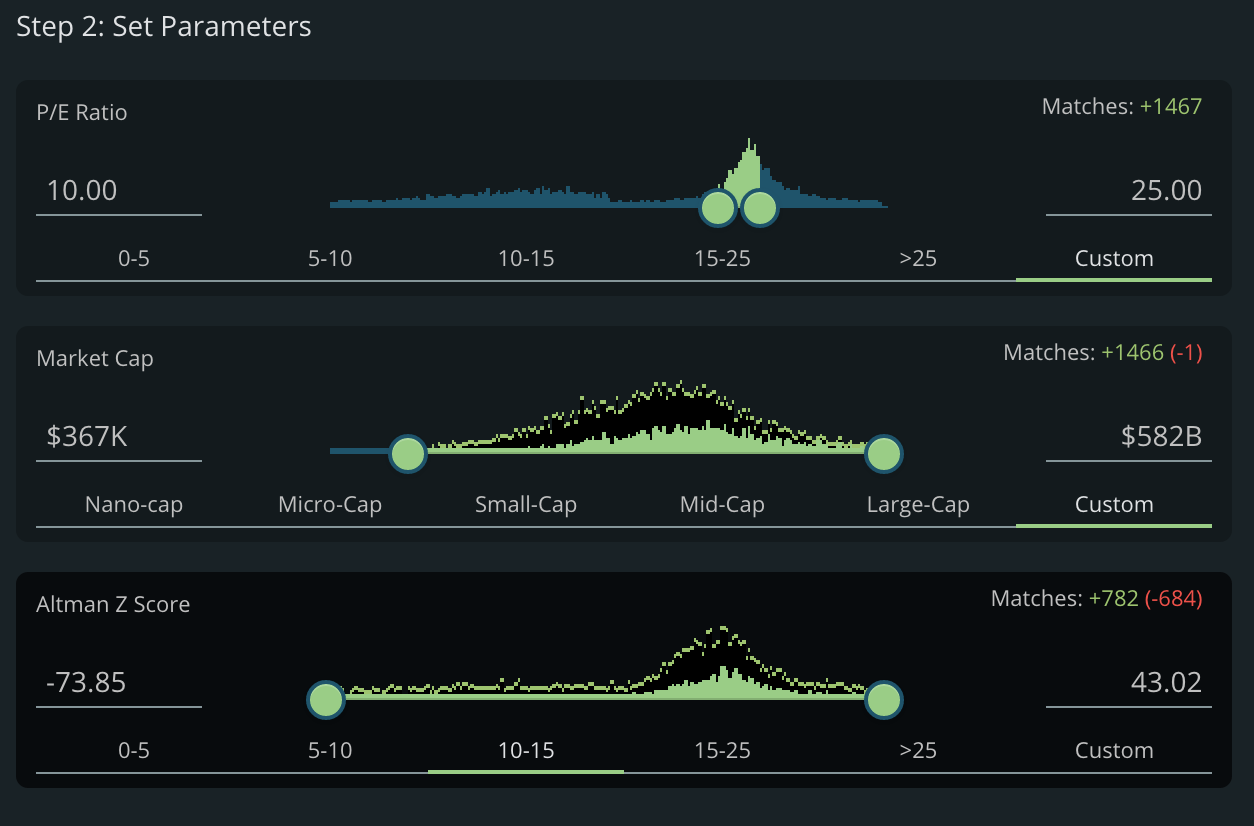
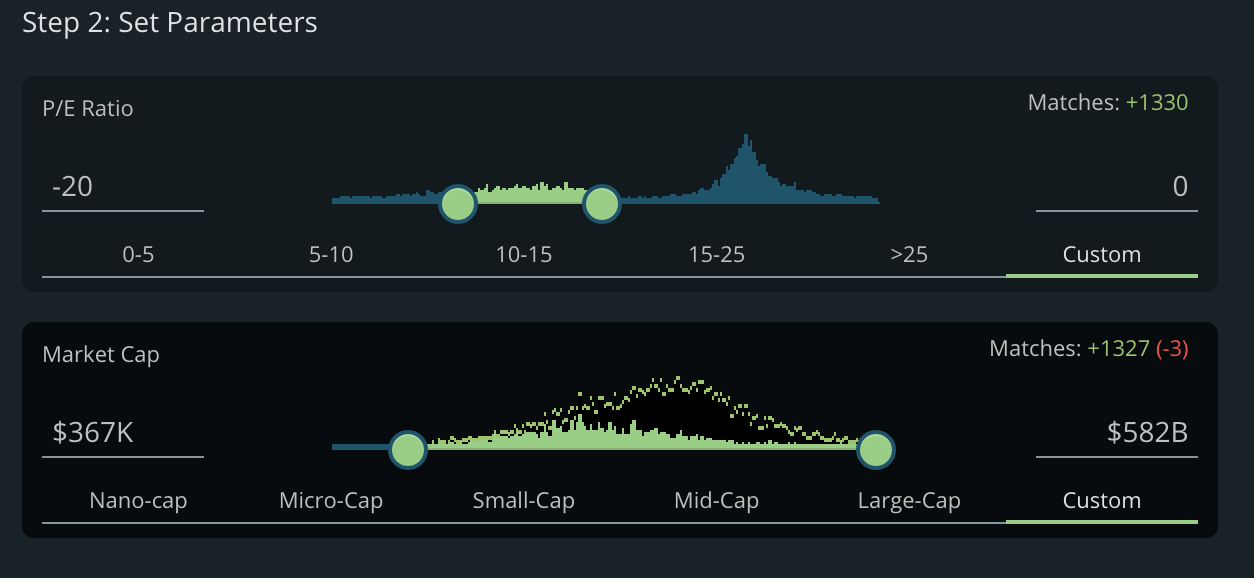
Shifting Distributions
We believe data visualization should be done with a level of minimalism. We don’t want charts for the sake of charts. And research has shown time, and a time again, less is more when conducting analysis with numbers.
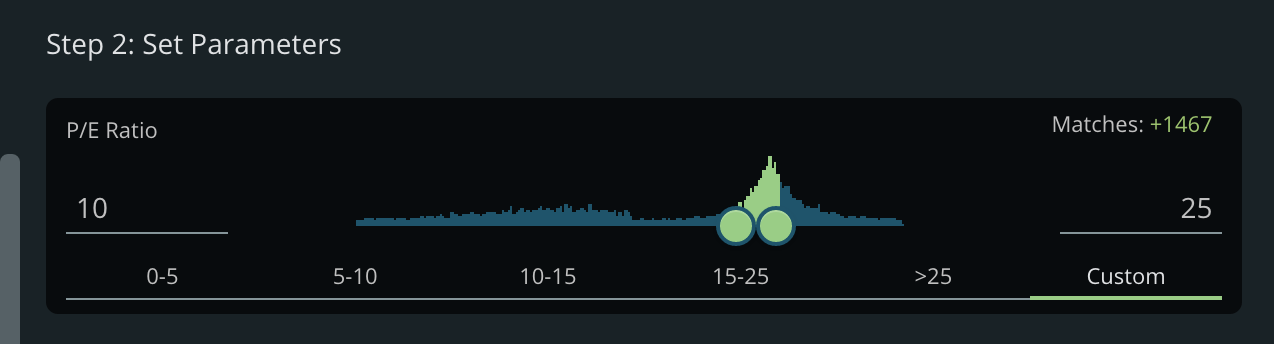
So we started off with the concept that when somebody screens, they should have context.
Is a filter for a P/E Ratio between 10-25 too common?
But that wasn’t enough.
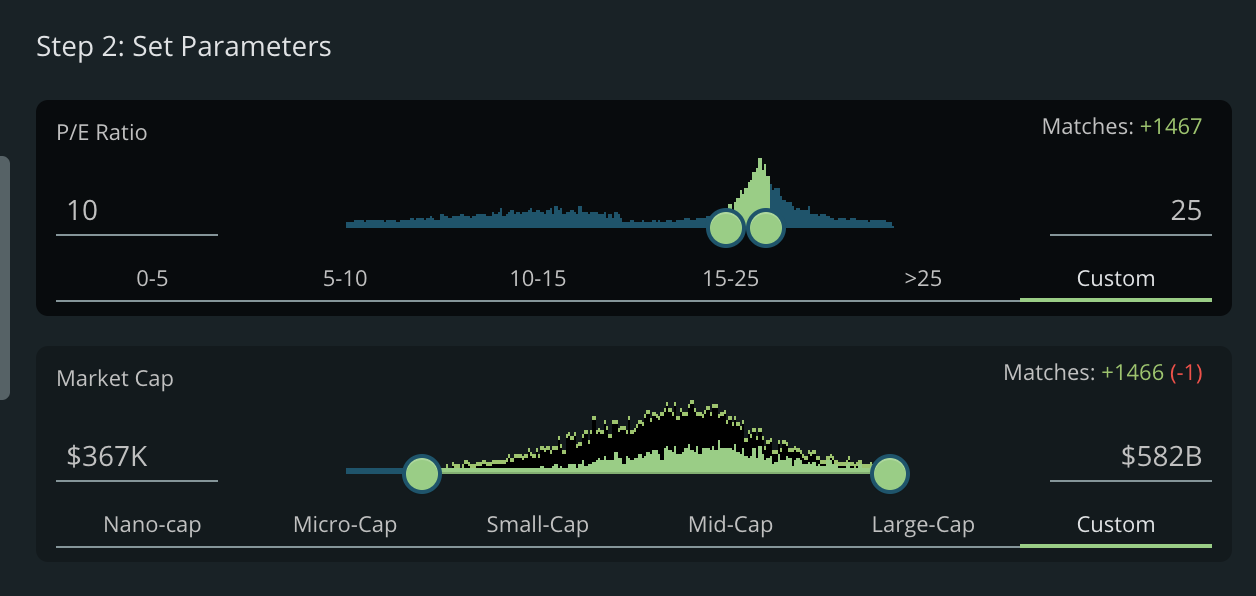
If we’re looking at a PE Ratio of 10-25, what kind of companies are we choosing? Are they small-cap or large cap? The Market Cap distribution has shifted and we want to know that.
Announcing:
The Shifting Distribution
We can see that a P/E of 10-25 leans slightly toward larger companies.
How about a P/E ratio of -20-0.
The distribution has switched largely to smaller Market Caps.
Suddenly, you now have context into all of your screening metrics. And the best part? It’s all done in a flash of a second. If you don’t believe us – check it out here (no registration required): Tiingo Screener
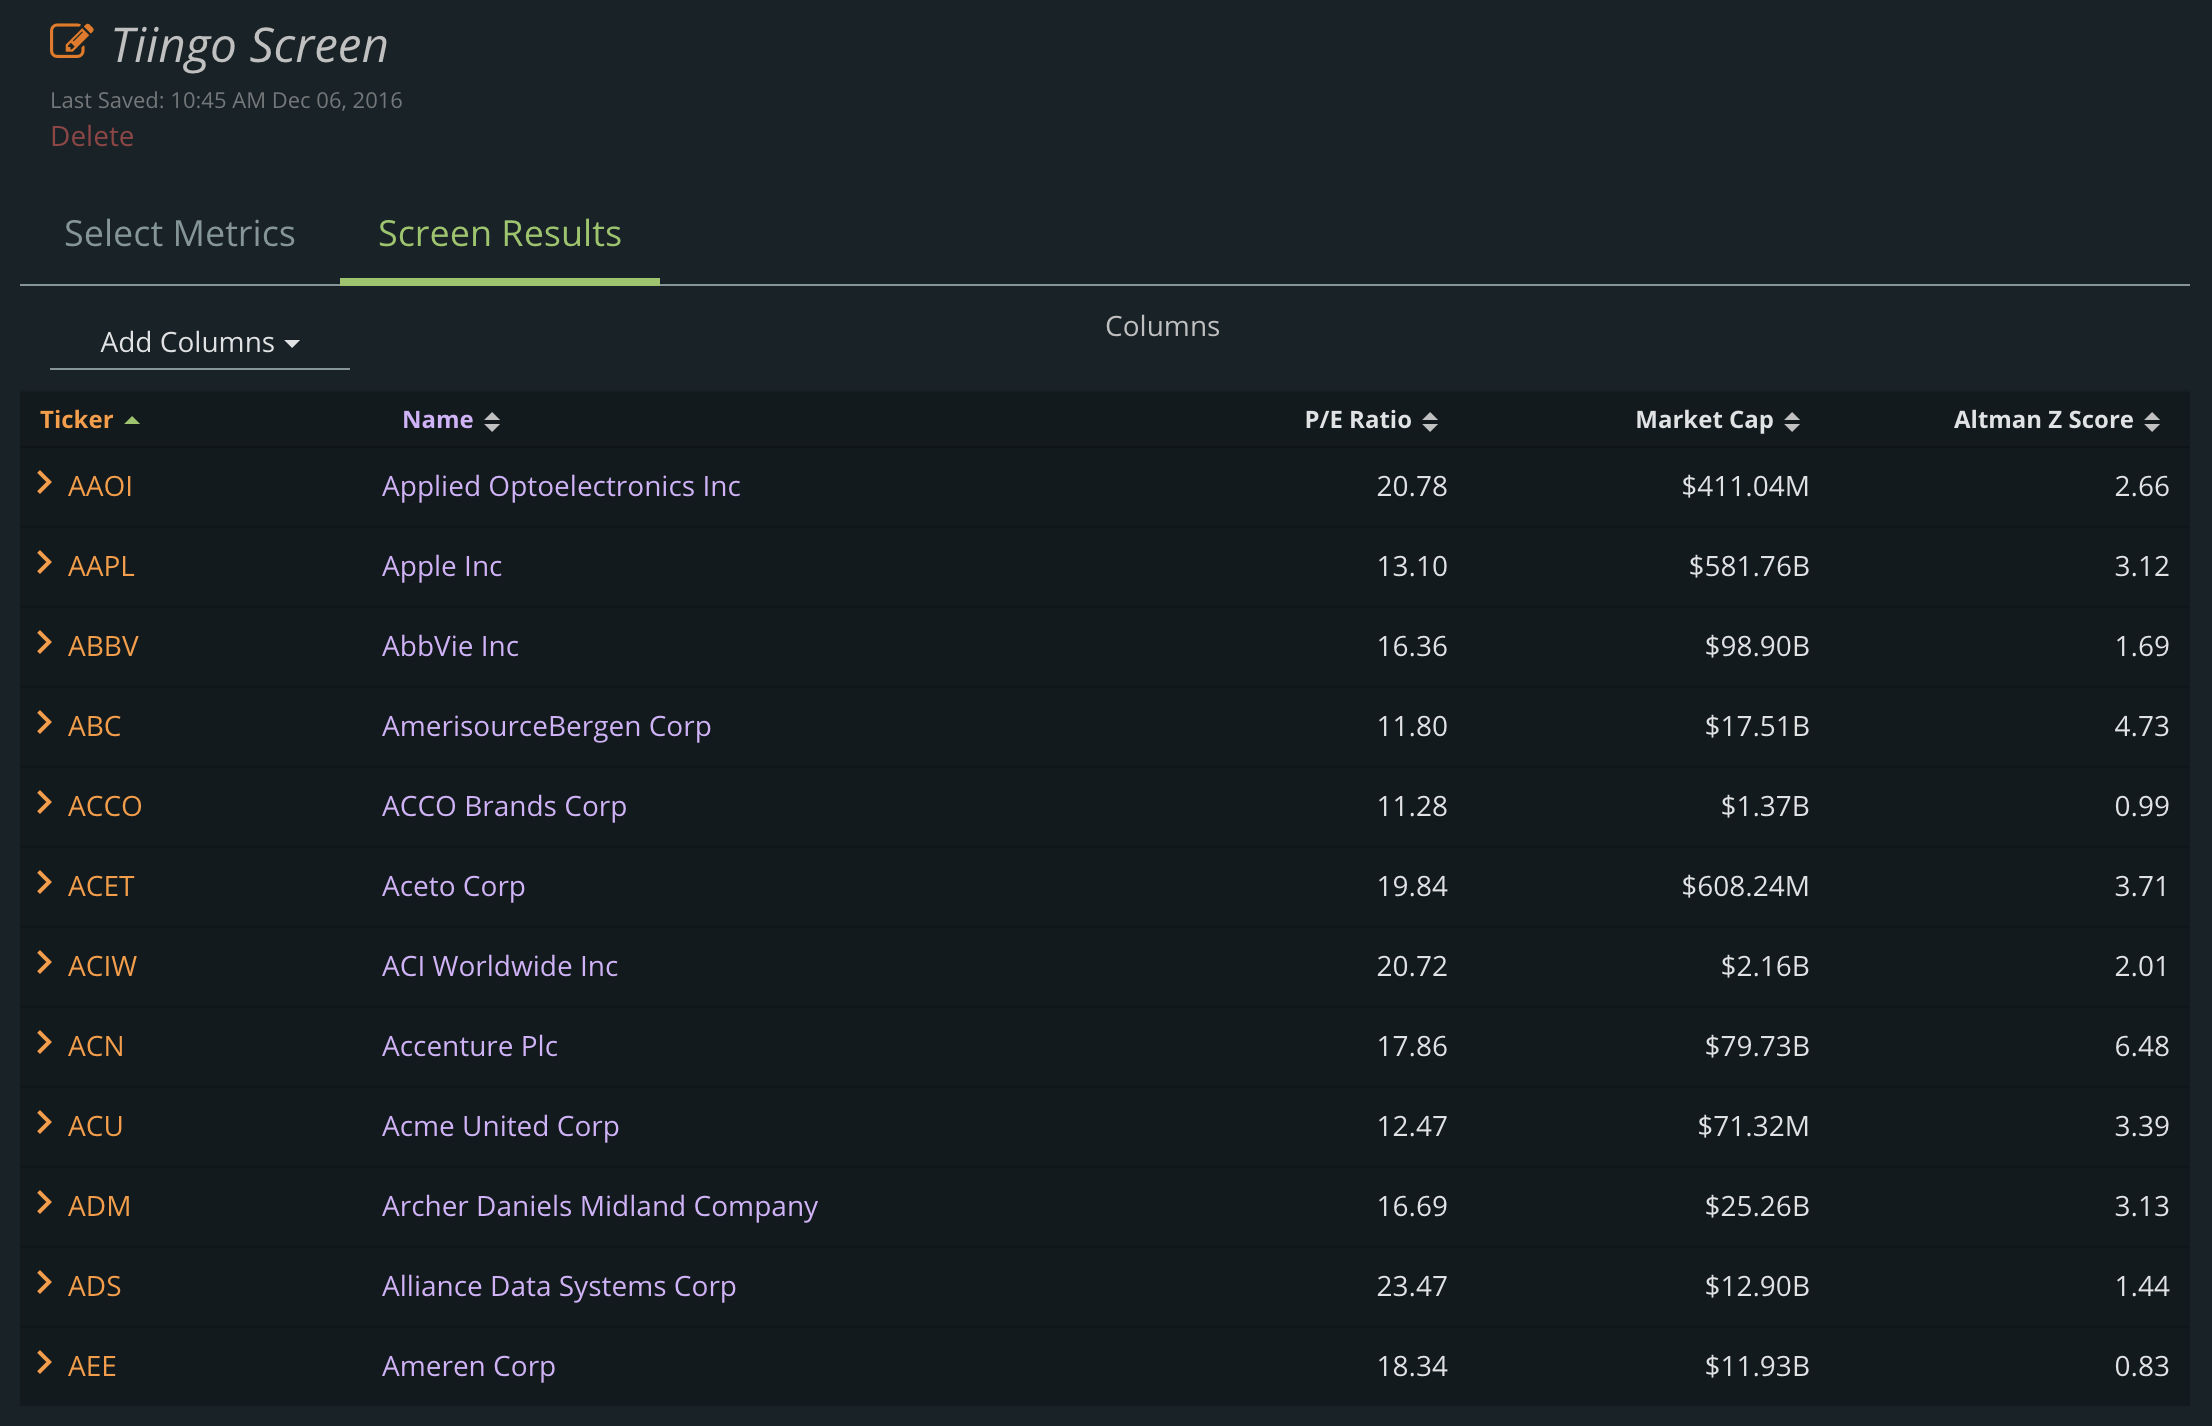
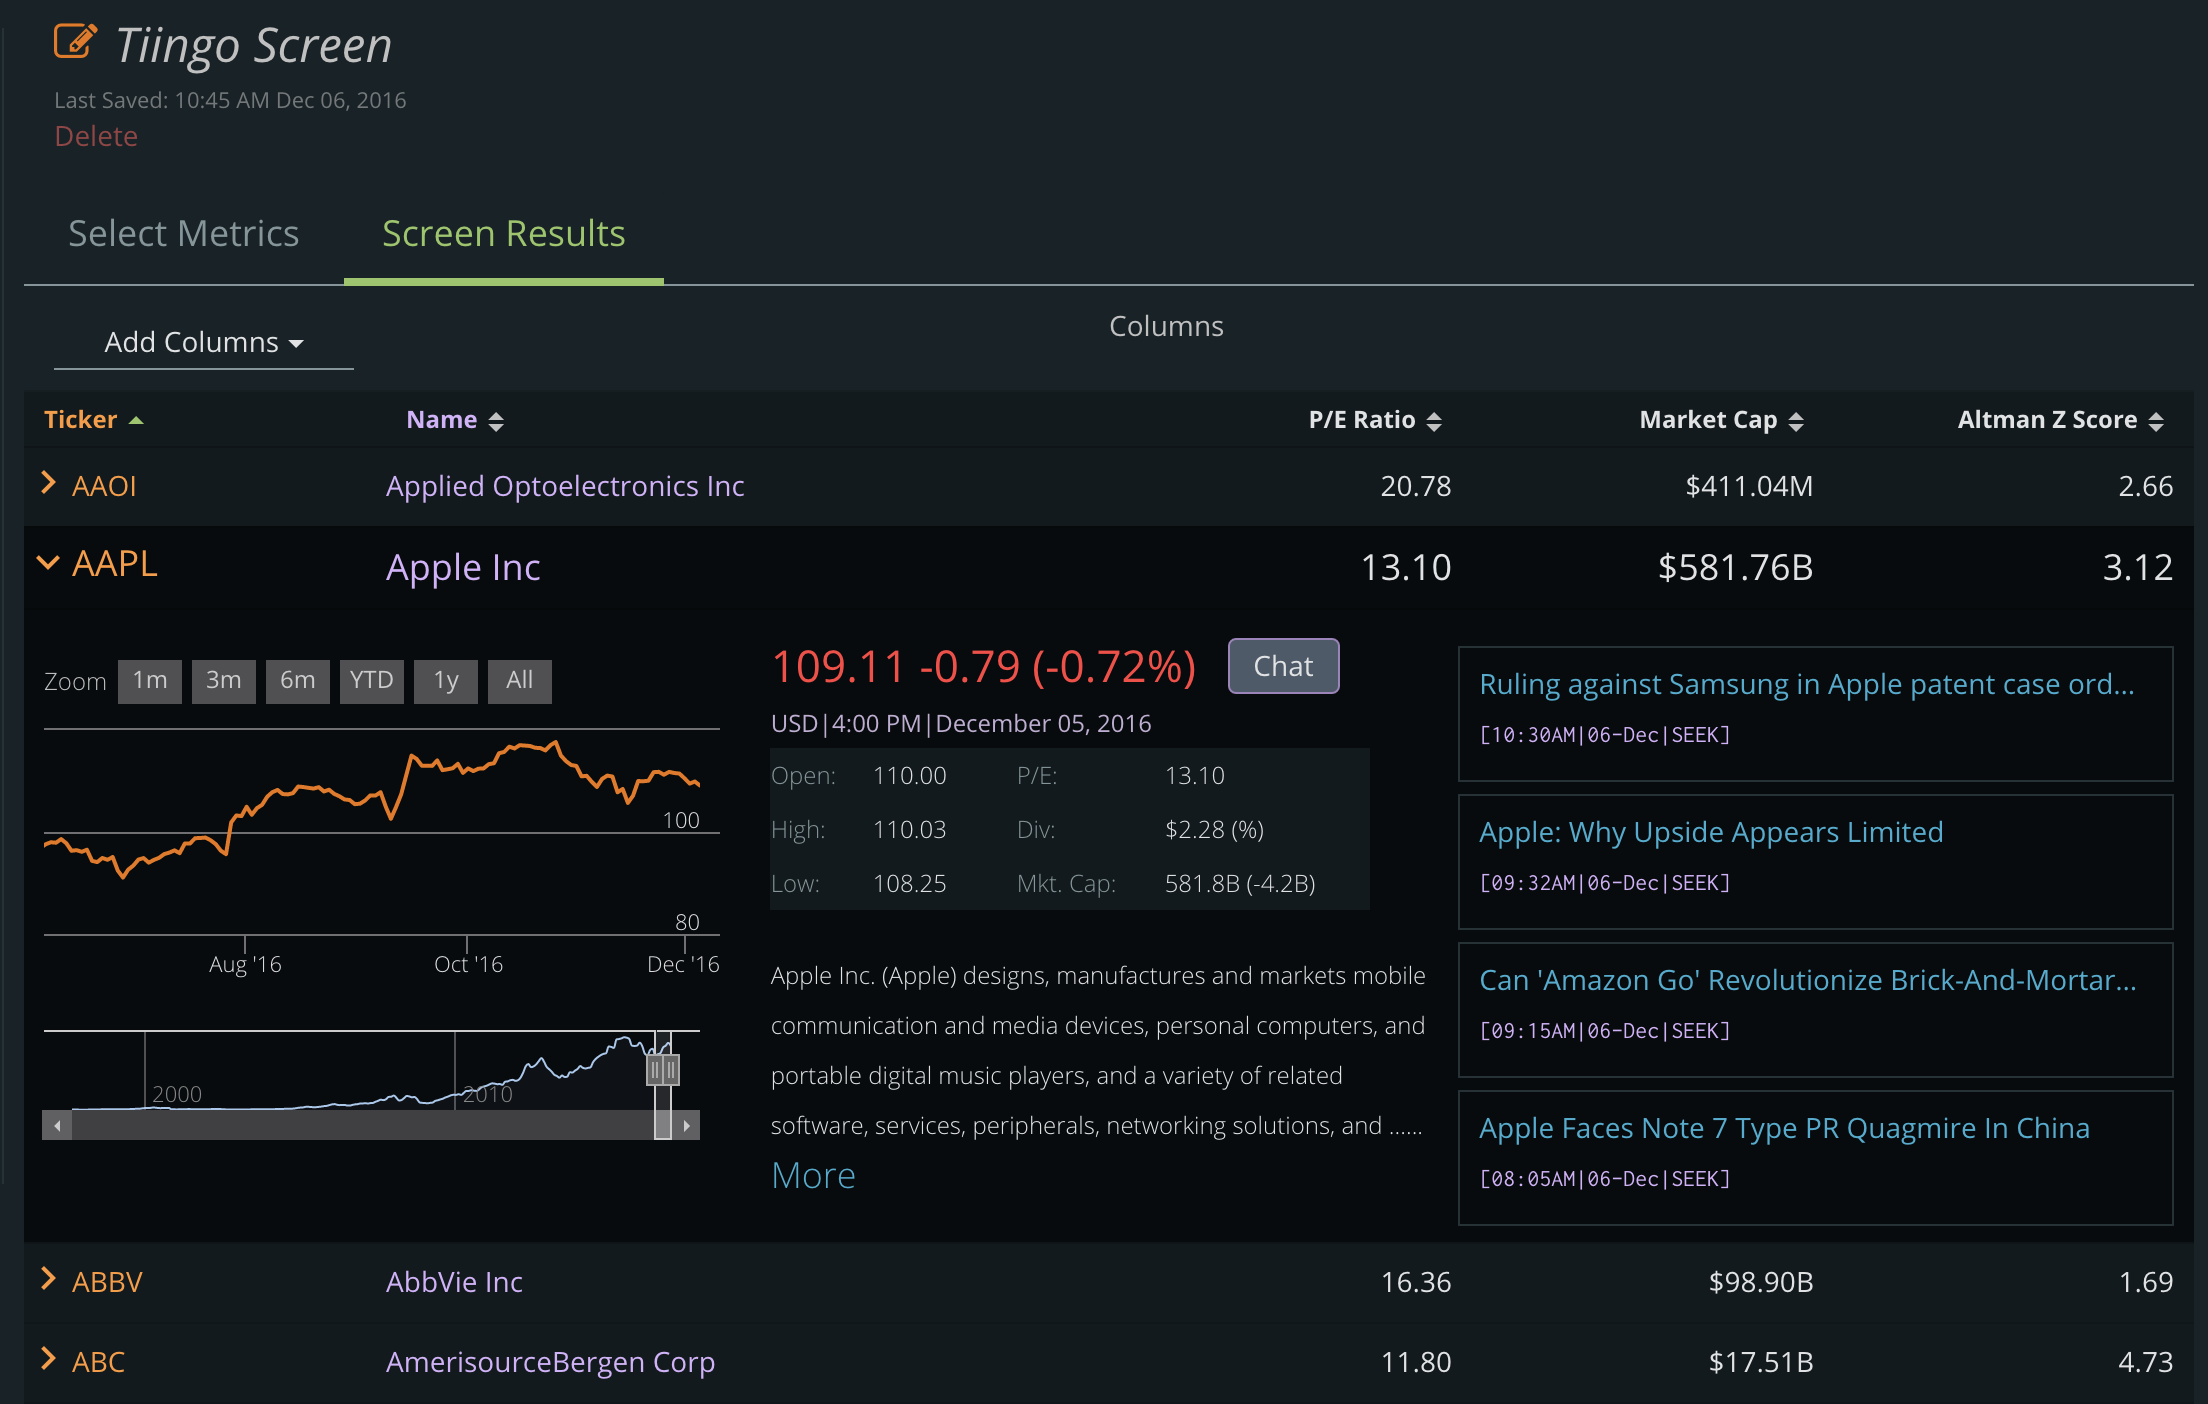
The Results
We wanted our users to be able to see the latest data – quickly. Now the results show you metrics seamlessly and beautifully:
And you can simply click to see more about a company:
We know you’re going to love this new screener: Tiingo Screener
The Official Tiingo API has launched after months and months of people requesting this, followed by months and months of dev time. The reason it took so long? We didn’t just do standard-API stuff, but we built infrastructure in exchange data centers to help significantly reduce to costs to everyday users to financial technology firms and Institutional players.
For example, EOD data is included in the Tiingo price, whereas for financial technology firms: real-time data is $500/month instead of $4200/month.
In summary: the entire API was built with the idea, “how much can we give and get away with it?” instead of, “how much can we charge and get away with it.”
Every user is entitled to 40GB of bandwidth a month. Yes we realize that’s insane – it’s why we did it.
Every user gets 10k requests an hour and 100k requests a day. We plan to increase these as more datasets come online and as we phase out of beta. You can monitor your usage at: https://api.tiingo.com/account/usage
In order for us to track these limitations, we will need you to create an account (hope that’s ok!)
For those of you who have been keeping up with this blog, the Javascript container process is something I’ve been following closely for the past decade. Earlier in the year, Peter Kruger from Microsoft reached out asking if I could test their latest implementation, which we presented at //Build. It was an honor, and since then I’ve been advocating Microsoft and OpenFin’s implementation as my favorites.
In a nutshell: The Javascript container process let’s you take a JS website and make it feel native to the operating system – whether it’s iOS, Droid, or Windows. We’re going to cover the Windows Live Tile implementation here.
For those of you with Windows machines, tablets, or phones (okay Surface users and PCs) – you may see what Windows calls “Live tiles.” Windows 8 may have overdone it 😉 but Windows 10 nailed it. Tiles allow you to gain a snapshot of what the app is doing without having to open it. I always found this implemented on Android clumsy from a UI standpoint and the feature is mostly non-existent on iOS -with the exception of a Apple-apps like weather and the clock. I use an iPhone for the record.
But – Microsoft nailed it IMO with the perfect amount of structure and dynamic content. Whereas Android has widgets which are all sorts of shapes, Microsoft forces structure and lets you “snap” together tiles.
E.g.
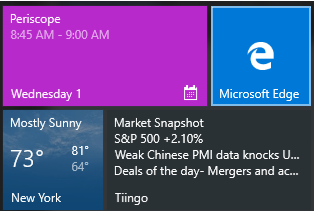
Windows Live Tiles
Notice the Tiingo one? Yeah we like it it too 🙂
We’re going to cover how we got these going in our pure-Javascript implementation. It didn’t require any native coding which was nice. It turns out if you’re using Hosted Web Apps, which let you convert your Javascript web app into Windows app, Microsoft injects a Windows library that you can use to interact with Windows.
Step 1 – Download the source code/generate the manifest
You need to generate source code, or a manifest file for this to work. If you don’t know what it is (like me initially), you can use App Studio which has a wizard and takes care of this for you. Visit here: http://appstudio.windows.com/en-us, make an account, and then created a “Hosted Web App” via this URL: http://appstudio.windows.com/projects/create
When you’re done with the wizard, click “Generate” and download the Source code.
Microsoft has pre-generated templates that you can “fill-in.” In reality, these are XML templates where you can change the content and then update it. So we’re going to choose a template, populate it with data, and then send the notification update to the Windows Notification library
For Tiingo, we went with tileWide310x150Text05 . Keep track of this “identifier” code as we will need it in our javascript code.
I like the idea of clean, text and for financial data images are not as necessary. Maybe later we will include them for news stories, but first I wanted to include text.
Once you choose the template, you can scroll down and see the XML. For tileWide310x150Text05 it looked like (taken from MSFT’s website):
<tile>
  <visual>
    <binding template="TileWideText05">
      <text id="1">Text Field 1</text>
      <text id="2">Text Field 2</text>
      <text id="3">Text Field 3</text>
      <text id="4">Text Field 4</text>
      <text id="5">Text Field 5</text>
    </binding>
  </visual>
</tile>

<tile>
  <visual version="2">
    <binding template="TileWide310x150Text05" fallback="TileWideText05">
      <text id="1">Text Field 1</text>
      <text id="2">Text Field 2</text>
      <text id="3">Text Field 3</text>
      <text id="4">Text Field 4</text>
      <text id="5">Text Field 5</text>
    </binding>
  </visual>
</tile>
Step 3 – Update the tile in your JS code
Next we have to tell Windows when to update the data and what to do.
We used this snippet, check the comments to see what each line means:
//See if the Windows namespace is available (injected by Windows for HWAs)
if (typeof Windows !== 'undefined' && typeof Windows.UI !== 'undefined' &&
typeof Windows.UI.Notifications !== 'undefined') {

     //setting dummy market data
     var marketData = {spy : {returns : .05}, newsLinks: [{title: "Headline 1"}, {title: "Headline 2"} ]};
     //Get the Windows UI Notifications
     var windowsNotifications = Windows.UI.Notifications;

     //Load in the template, which will contain the XML we can modify
     var tileTemplate = windowsNotifications.TileTemplateType.tileWide310x150Text05;
     var tileXML = windowsNotifications.TileUpdateManager.getTemplateContent(tileTemplate);

     //We now get all the text elements and append text nodes
     var tileText = tileXML.getElementsByTagName('text');
     //First line will be a header
     tileText[0].appendChild(tileXML.createTextNode("Market Snapshot"));

     //Next we get the returns and append a "+" sign if the return is >0. For negative numbers, JS defaults to appending a "-"
     if(marketData.spy.returns > 0)
          tileText[1].appendChild(tileXML.createTextNode("S&P 500 +" + (marketData.spy.returns * 100).toFixed(2).toString() + "%"));
     else
          tileText[1].appendChild(tileXML.createTextNode("S&P 500 " + (marketData.spy.returns * 100).toFixed(2).toString() + "%"));

     //Next we add the news headlines
     tileText[2].appendChild(tileXML.createTextNode(marketData.newsLinks[0].title));
     tileText[3].appendChild(tileXML.createTextNode(marketData.newsLinks[1].title));

     //Create the TileNotification, passing our modified XML template and then send the update command
     var tileNotification = new windowsNotifications.TileNotification(tileXML);
     var tileUpdater = windowsNotifications.TileUpdateManager.createTileUpdaterForApplication().update(tileNotification);
 }
Since we are using Angular, we wrapped the initial call in a $timeout() and then set an $interval to get the marketData JSON object from our back-end every 30 seconds.
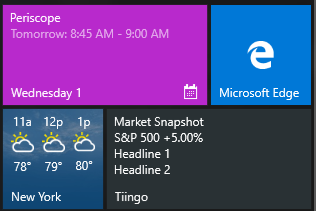
Step 4 – Test the app by running it in Visual Studio, pin the app to your start menu, and voila!
Beautiful!
Our Example Tile
AWS vs Packet.net Why we left AWS
Benchmarking AWS’s Network, Disk, and CPU Performance
If this sounds like a glowing review of Packet.net – it is. I found myself re-reading this post over and over, trying to make it sound less shrilly – but I can’t. It’s just a ridiculously good product and value – EC2 containers just don’t make sense anymore.
A friend once told me, “Rishi – sometimes if you don’t advocate a product aggressively – you can be doing society a disservice in your attempt to be neutral. If the value is so good, you must tell everybody about it.”
This is one of those times.
EDIT: Feeling really grateful the HackerNews community decided to link to Tiingo a second time. In the first HackerNews posting many of you asked for an API, which is what led to me finding the AWS bottleneck. The API launched [quietly] this week at: https://api.tiingo.com where Tiingo is now the first company to bring IEX (anti-HFT exchange/darkpool) data to mainstream Financial Tech firms. Kind of went full-circle as this post wouldn’t have existed without the original HN coverage.
TL;DR:
The performance of AWS on network speed, disk speed, and CPU performance are quantitatively just “not good,” for what we needed. When we introduced real-time market data, we were in search of our bottleneck and realized it was AWS. We made the decision to switch to Packet.net and the below reflects on our decision and explains why. The benchmarks continue to reaffirm our decision. Having said all of this, certain features of AWS remain incredibly convenient like S3, Cloudfront, and Route53 – but we can’t justify using EC2.
In Networking: Packet is significantly faster, more stable, and 15%-44% cheaper
In Disk Usage: Packet is more performant and 92% cheaper
In CPU: Packet is 30-40% more performant and 15% cheaper
In machines: Packet’s systems are all bare-metal/dedicated, whereas AWS charges extra for dedicated machines
If you’ve noticed Tiingo being particularly snappy these days, it’s because I couldn’t stand it anymore. I had tried everything – buying more expensive instances on AWS, allocating more space, scaling horizontally, but it wasn’t matching up to my local dev machines. And so I started searching for the bottleneck – only to realize it was AWS.
I started researching AWS, I found I wasn’t alone. Many people experienced what I had but I tried prolonging the switch. Trying to change cloud service providers is frustrating: scripts break, performance temporarily suffers, you experience downtime, and you know there will be unknown-unknowns.
Recently we just got real-time market data and this exacerbated the issues. Our websockets were being overwhelmed in queues and throwing more nodes at the problem was becoming expensive. We were trying to put a bandaid over a burst pipe. I finally decided on Packet.net and I want to share the reasons why. I’ve included benchmarking results to help emphasize the point.
Our search was motivated by two major reasons:
The costs were getting out-of-hand
After reading the below Reddit post on AWS’s [lack of] network stability, we started asking around and realized the experts were right… AWS’s network is slow. If we are going to give our users real-time data directly from the exchanges, that’s a heck-of-a-lot of data and we need it to be as fast as possible.
The Reddit/Blog Post was from an engineer at Stack Overflow.
We explored options like DigitalOcean, but Tiingo, like all financial data/analytics companies, is very data heavy and their plans didn’t allow for flexible data storage (EBS on Amazon for example). We looked into Rackspace and Azure, but the cost differentials didn’t make it seem worth the transition. Admittedly, having used Rackspace in the past – I’ve always loved their customer support and was personally disappointed I couldn’t justify the cost.
Eventually I came across Packet and spoke to their engineers since I hadn’t heard of them before.
I took a chance. It paid off.
I told them my concerns and what I was trying to solve (market data connectivity and high data transfer rates). One of the co-founders, who was a networking engineer, personally oversaw my connectivity project to the data exchanges. I’m pretty sure this was Paul Graham 101 on start-ups and customer service.
Ultimately though – I’m a data nut and so I decided to benchmark AWS vs Packet and was really curious about the Reddit comments on AWS’s network stability. The benchmarks closed the deal for us. It was a no-brainer. Part of the major reason being that Packet.net is bare metal (dedicated physical machines) whereas AWS tends to be focused on virtual machines. The hardware/pricepoint is actually even cheaper on Packet. We are paying 1/3rd of what it would cost to get a similar, less performant, system on AWS.
SO here you have it!
The tests below compare AWS vs Packet for disk, network, and CPU benchmarking – and also cost.
I’ve outlined and commented the results below so you can reproduce the tests.
Hardware
Since we are testing Packet vs AWS, we started off with the Packet hardware and found the AWS price equivalent. We started with the Type 1 and worked backwards to find the equivalent in performance/price on AWS.
Note: For the network test, we also test a smaller machine. The reason for the lighter hardware is for load balancing (HAProxy in this sense). If all of the back-end servers can have high network throughput, but we need to send it to the end-user, the load-balancer’s networking performance will be the determining factor. This is especially important in cases like real-time data.
Packet:
Instance Name
CPU
Memory/RAM
Price
Price/Month
Notes
Type 1 (Server)
(4 core, 8-threaded) 3.4ghz Intel Xeon E3-1240 v3
32gb
$0.40/hr
$0.37/hr if reserved for 1 month
$292.80/month
Type 0 (Load Balancer)
(4 core) 2.4ghz Intel Atom C2550
8gb
$0.05/hr
$0.0459/hr if reserved for 1 month
$36.60/month
What somebody may choose as their load balancer
*Note:We assume 732 hours in a month; but if you reserve a Packet instance for a month, they will only charge you 672 hours per month. However, to make apples-to-apples comparisons, all calcs in Price/Month assume you choose hourly pricing (732 hours for 1 month) to keep things normalized.
AWS:
Instance Name
CPU
Memory/RAM
Price
Notes
m4.2xlarge (Server)
8 VCPU (2.4ghz Intel Xeon E5-2676)
32gb
$0.479/hr
$350.63/month
xlarge was chosen for it’s optimized network performance
t2.medium (Load Balancer)
2 VCPU (Xeon processors burstable to 3.3ghz)
4gb
$0.052/hr
$38.07/month
What somebody may choose as their load balancer
OS:
Ubuntu 14.04 server
The Benchmarks
Network:
For this test, we used iperf3 as per the AWS documentation
We wanted to simulate a very real-world network configuration for ourselves – basically what our site looks behind a load balancer. Load balancers tend to require very low processing power, and serve as a network bottleneck to the user.
We are testing:
Internet -> Load-balancer (Haproxy)
Load-balancer (HAProxy) -> Server
Server -> Server
The “Internet” machine used was an Azure machine. Not perfect, but we figured it was a good 3rd party control.
You can view the detailed methodology in the Appendix below.
Results:
Performance:
AWS came out incredibly inconsistent – with a high std. deviation and low mean transfer rates. What AWS considered a “High” performance network tier, was the least expensive tier on Packet. Why didn’t we use AWS Elastic-Load-Balancer (ELB)? For our use case with websockets, – we found ELB to be lacking what we needed. This will be a blog post for a later day.
Comparing transfer speeds across machines on Packet vs AWS
What was particularly interesting was the inconsistency of the lower tier machines. We ran our benchmarks over an hour, and here is what the rates looked like when making requests to-and-from the lower tier (t2.medium) EC2 Instance. This seems consistent with their “burstable” instance – which is great and all…except Packet’s lowest tier outperforms it:
AWS’s speeds decay significantly over time for the T2.medium instance- making it a poor choice for a load balancer
Pricing:
The above AWS configuration is $.081/hour more expensive than Packet and also less performant.
Another consideration is bandwidth costs. AWS charges $0.09/GB (for the first 10TB) out to the internet. Packet.net charges $0.05/GB out to the internet. Within the same data centers (availability zones in AWS), both Packet and AWS are free. However, when transferring to a different availability zone, AWS charges $0.02/GB and Packet.net charges $0.05/GB.
Conclusion:
Packet is the clear winner in this. In both absolute speed and stability. In terms of price, Packet is cheaper by $.081/hour in the above configuration, or 15% cheaper – and for the majority of our bandwidth we go external to the internet. In outbound internet traffic, Packet is 44% cheaper.
Disk:
Packet offers two storage types: Basic (500 IOPS) and Performance (15,000 IOPS).
We created a EBS volume on both Packet & AWS with provisioned IOPS of 500 and then 15,000. Then we used sysbench to run an I/O test (see Appendix below for methodology).
Results:
Performance:
When getting to the 15k IOPS, we saw a more significant performance differential favoring Packet. At Tiingo we used the performance tier given the amount of data we store and calculate.
Price:
Provisioning 15,000 IOPS on AWS @ $0.065/IOPS = $975. But wait, that’s not all! They also charge $0.125/hour per GB. So a 15k IOPS 500GB HDD on AWS would be $1037.50
On Packet it would be 500GB * $0.15 = $75.
Doing a bit of algebra, the cost for 15k IOPS on AWS would be cost effective if you have >39TB of storage. That’s right – Packet is cheaper until you hit 39TB of storage….
Conclusion:
Packet is literally 92.3% cheaper than AWS for 15k IOPS performance, and Packet is even more performant. It’s the victor in disk performance as well.
CPU:
CPUs cannot be benchmarked purely on the speed of the processor [clock] alone. For these reasons, we ran a sysbench test as well on different threads.
Results:
Performance:
The results are damning for AWS. On an 8 processor machine, the benchmark ran slower on 8 cores than 4. I ran this multiple times, double checked to make sure this was an m4.2xlarge. Then I spun up another m4.2xlarge and the results were more in line with what I expected (still slower than Packet).
However, I am going to keep the original instance’s benchmark below to highlight the point of noisy neighbors. With AWS, you can get a shared machine with other neighbors who are processor intensive and reduce your performance. This is what virtualization is. With Packet, you get a dedicated system. What most likely happened was that our original machine had a noisy neighbor.
Here are the results – you can see at 8 threads Packet performs 4x faster than AWS.
Packet is 4x Faster on This Noisy Neighbor AWS Machine
OK OK – I will show the second instance’s performance – even when there are no noisy neighbors.
Packet is 30-40% faster even with a better AWS instance
Even with a non-noisy neighbor machine, Packet is 30-40% faster in processor benchmarks.
EDIT: A user asked me to run the benchmark using a compute-optimized EC2 instance. I decided on c4.2xlarge which has 8 threads, but half as much memory (16gb). It cost $0.419/hour ($0.019/hr more expensive than a Type1 Packet server). Here are the results (Packet wins again but less drastic of a margin)
Even using AWS Compute-optimized, Packet Type 1 outperforms it
Price:
On the above setup, Packet is $0.079/hour cheaper.
Conclusion:
There really is no way around it – the above benchmarks show the issues with virtualization. Even with those issues aside, AWS is slower and more expensive. Packet wins this one again.
Conclusion
Even giving AWS the benefit of the doubt, there is no way around it – Packet is faster and SIGNIFICANTLY cheaper.
Let’s take a very real-world example of our server set-up:
Packet:
Instance Name
CPU
Memory/RAM
Price
Price/Month
Type 1 (Server)
(4 core, 8-threaded) 3.4ghz Intel Xeon E3-1240 v3
32gb
$0.40/hr
$0.37/hr if reserved for 1 month*
$292.80/month
Type 0 (Load Balancer)
(4 core) 2.4ghz Intel Atom C2550
8gb
$0.05/hr
$0.0459/hr if reserved for 1 month*
$36.60/month
15k IOPS 1TB HDD
$0.15/GB
$150/month
2TB Outbound Bandwidth
$.05/GB
$100/month
Total
$579.40/month
*Note:We assume 732 hours in a month; but if you reserve a Packet instance for a month, they will only charge you 672 hours per month. However, to make apples-to-apples comparisons, all calcs in Price/Month assume you choose hourly pricing (732 hours for 1 month) to keep things normalized.
AWS:
Instance Name
CPU
Memory/RAM
Price
Price/Month
m4.2xlarge (Server)
8 VCPU (2.4ghz Intel Xeon E5-2676)
32gb
$0.479/hr
$350.63/month
t2.medium (Load Balancer)
2 VCPU (Xeon processors burstable to 3.3ghz)
4gb
$0.052/hr
$38.07/month
15k IOPS 1TB HDD
$0.125/GB + $0.065/provisioned IO
$1,100/month
2TB Outbound Bandwidth
$.09/GB
$184.23/month
Total
$1,838.84/month
Packet is literally less than 1/3rd the price and is more performant than AWS.
It’s allowed us to deploy resources we didn’t think would be affordable before.
Thank you to everyone @ Packet for making this product possible.
Further Steps:
If anybody wants to continue this study, I would love to hear your results. AWS does allow you dedicated machines for extra $, but we didn’t bother testing them since Packet is already cheaper than their virtual machines.
Appendix:
Methodology:
Networking:
Setting up AWS:
We want to make sure we give AWS the best chance. First, we have to make sure enhanced networking is enabled. Running the command:
modinfo ixgbevf
Will give us the output, and look for “version”. In our instance we have version 2.11.3-k. Amazon recommends we upgrade. For the ubuntu users out there, follow this gist and run the commands:
Let’s also check via command line to make sure enhanced networking is supported (Ubuntu 14.04):
sudo apt-get install python-pip
sudo python pip --upgrade pip
sudo pip install awscli
#Note: Create an IAM user and attach the policy: AmazonEC2ReadOnlyAccess
#Use the security credentials in the configure policy
aws configure
#after configuring run (replacing instance_id with your instance_id):
aws ec2 describe-instance-attribute --instance-id instance_id --attribute sriovNetSupport
If you get the output, you’re good:
"SriovNetSupport":
{
"Value": "simple"
},
Next, we used iperf3 to run the diagnostic scripts and scrapy bench. iperf3 is a common network benchmarking tool and scrapy is the framework that powers Tiingo’s scraper farm. We figured Scrapy would be another real-time test to see how things flow.
Meaning we ran the tests for one hour (3600 seconds), and with 10 processors in parallel. Also note to set the -B option on Packet machines as it takes advantage of the full bonding algo and increases thoroughput.
Note: make sure to use the internal IP addresses to give the best benefit of doubt 🙂
Disk:
First install/update sysbench on your Ubuntu machine using the code:
In this post we’re going to discuss the protagonists who are creating tools and frameworks to unify the “App” experience across desktop and mobile. If successful, this will mean we are getting closer to mobile and desktop cross-platform and cross-browser compatibility. Please read part 1 if you are curious as to what this problem has meant for firms and developers.
Google
All UX engineers will tell you that the mobile interface is fundamentally different than a desktop application. After all, we all know what the “three lines” mean, right?
The three-lines we came to know as the “Hamburger Menu”
It is universal code for, “There are more features that will show themselves if you click us. Do it. Click us.”
What Google is therefore doing is creating a design specification that makes a unified standard across both desktop and web applications. For a very comprehensive description of this, check out their website available here: Material Design Introduction. It’s a wonderful read of their philosophy and great information for those of you learning UX like myself.
One example of Material Design, for those of us familiar with Google’s Hangouts App, is this menu:
This is how the menu may look on mobile
This is how the menu may look on a desktop
Here we can see Google is attempting to unify the experience of the “Hamburger Menu,” by creating both a mobile and desktop interface for it.
But Google isn’t the first to attempt this.
Note: The hamburger menu has it’s critics, but that is beyond the scope of this blog post.
Twitter (Bootstrap)
Twitter created a platform known as Bootstrap that’s become ubiquitous and set a new standard for a unified desktop/mobile experience, otherwise known as “responsive.” It set the foundation for many of the design frameworks you see today and almost all responsive web applications rely on this framework today.
It popularized the “grid layout” and always had the philosophy of “Mobile First.” It even helped set the mobile and web icons you see today. For a full list of all the features please visit: http://getbootstrap.com/components/
If there was a museum of “web development,” I would argue Bootstrap would have its own exhibit. The impact it’s had is absolute awe-inspiring and all of the criticisms people have of it come with an implicit asterisk:
*We are not insulting bootstrap. It’s amazing. The whole reason we can critize them is because they set a new standard that got people thinking differently.
Microsoft has been the platform I have been the most excited about. Close friends of mine have heard my rants on unified web experiences, so it felt like kismet when a senior product individual reached out to me asking to test out their Web App Studio.
I was impressed with the premise: they are allowing individuals to create their own apps meanwhile creating a container process to take HTML5 web apps and make them feel like native experiences. While they are not the first (as we will discuss below), they are the major web company actively supporting this process given the deprecated “Mobile Chrome Apps.”
The premise of the App studio is two fold (Fed Dual mandate anyone?…sorry)
Allow users to create their own apps in a point-and-click manner
Allow your HTML5 web application to feel like a native app
While this post won’t get into 1, it does help many small businesses who want an app alongside their product.
With respect to 2, I found the app submission process relatively easy, with the majority of my time spent typing out app descriptions, ratings, etc. The actual wrapping of the Tiingo took all of about 15 minutes.
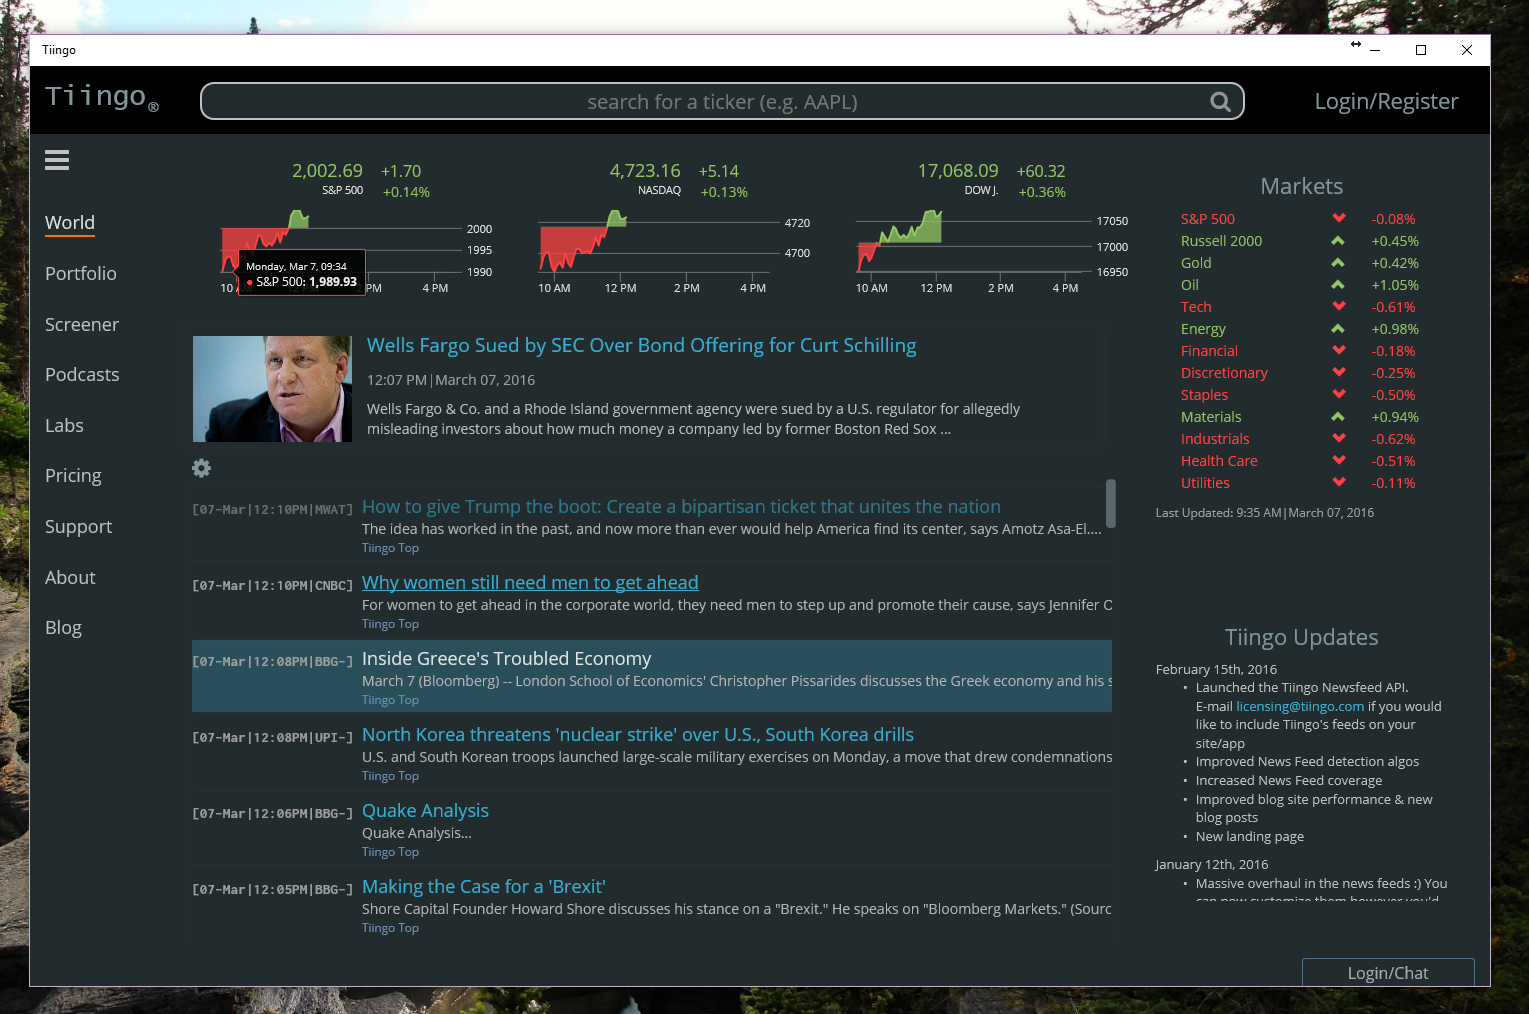
Here is a screenshot of Tiingo running a native desktop application in Windows 10:
Tiingo Running in their Web App Studio Container
For those of you who’ve never published an App before in the Windows Store, use the videos in the middle of the page: Web App Studio. I find it difficult to sit still and watch videos, so I will be posting a graphical walk-through of how to do this.
Having been around web development and seen multiple container processes come and go, this has been the easiest experience to date. So far I have not found the same memory leaks that have plagued the fork’d Chrome projects with a similar premise in mind.
Also – a thank you to Microsoft with their Edge browser. Seriously -the company that brought you IE6, has launched a new browser that is challenging other browsers in benchmarks (include Google’s benchmarking tests) and recently they have open-sourced their javascript engine: https://github.com/Microsoft/ChakraCore. While it has a ways to go, especially with extensions and feature compatibility, initial results are more than promising – they’re exciting. And thankfully, this performant javascript engine is powering their Web App container.
I love what this platform is doing, but I detest that it’s had to exist because the major tech giants couldn’t get together to hammer out a standard (looking at you Apple….from my iPhone).
The goal of this platform is to take an HTML5 web application and wrap it so it can be pushed to the App Stores of Google, Apple, and Microsoft. This has benefits as this means a native feel and interaction with a phone’s hardware and interfaces such as cameras, GPS, and notifications.
The downside, and similar to the Java Virtual Machine, is that these programs run in Javascript and the performance noticeably slower since native code will always be faster than Javascript (although the gap doesn’t have to be this wide – something Java has closed decently well).
Compatibility Features with Native Applications
Conclusion
The open source and web-dev communities are doing wonderful things to address the problem of cross-platform/browser compatibility, but ultimately it is the platforms that have web stores that should be pushing forward with a solution. If Apple continues down this road, it will only be a matter of time before development becomes more inconvenient, and if market-share shifts, the iOS will become the second app we develop for instead of the first. Even more so, arguably the Safari browser is becoming more difficult to work with. As Microsoft can tell you, that’s a hard reputation to brush off.
Ultimately, projects like Apache Cordova are wonderful, but I hope go the direction of jQuery where they are no longer necessary or become components of high-level frameworks like Angular. The work jQuery did set a new standard and I hope Cordova goes the same way.
I applaud both Google and Microsoft from tackling this problem head-on with different solutions: support for Cordova, making a unified UX, and explicitly supporting Web App Containers to save developers time.
Well done –
Apps Have Recreated the Problem the Web Was Trying to Fix (Part 1)
It’s no question the word “App” has become ubiquitous and for good reason. For users it’s allowed us to install entire applications within a click. Just 10 years ago, we had to run into a store like Best Buy, look for an oversized software box, and load the game or software over 4 CDs. For developers, it’s meant we can take our product and unleash into a massive pipeline where people are already on their phone constantly.
I still have font memories of replacing CD after CD 6 times to install this game
The problem is we’ve distracted ourselves from a problem the web has been working to solve: cross-platform compatibility. In fact, we’ve made it even worse.
Let me explain.
Before Tiingo and trading, I used to work at the National Institutions of Health (NIH) 10 years ago where I co-founded an open-source computational chemistry tool. We called this project CHARMMing (Chemistry at HARvard Molecular Mechanics INterface and Graphics – yes I also had to take a breath to finish the acronym).
I was a junior software engineer at the time but I remember the discussion vividly. We knew we wanted to make a pretty interface to this complex chemistry package. We wanted this UI to be both educational and friendly, but we also wanted to disrupt a commercial vendor that was charging insane rates (and now you know where the ethos of Tiingo started).
The problem was that if students were part of our audience, how could we make this chemistry package accessible when it was only usable via scripts, command lines, and on UNIX based systems? If we wanted non-technical chemists to conduct research, asking them to run scripts and switch to RedHat would be unreasonable.
So how could we make our program accessible on Windows, Macs, and Linux-based systems? We call this concept cross-platform compatibility.
For those of you new to programming, this has always been an issue. You can see it today where some Apps are only available for Androids and/or iPhones. The reason a solution to cross-platform compatibility been so coveted in the programming world, is that if solved, it would result in hours of development time saved. It would be millions of dollars saved, and keep developers from pulling their hair out. It would mean developers would not have to make one app for iOS and another for Android. There would be just one app.
This is why you see certain applications more feature rich in one operating system (or phone) over another. It’s also why you see the wide-spread use of Java – a programming language meant to solve this problem.
The obvious solution to the cross-compatibility of our chemistry software at the time, which many people supported, was indeed Java. At the time though, Java was still riddled with performance issues that really made our process difficult. But the deciding factor was we didn’t enjoy coding in Java and we were just getting into Python. So we could’ve used Java, but something inside of us hesitated. We struggled with this until a chemistry researcher in our lab proposed something different:
“What if we made a web application? I think this will be the future of software development.”
Looking back that foresight was visionary.
Keep in mind this was 2005. We had witnessed the end of the tech bubble, the iPhone hadn’t been invented yet, YouTube has just been founded, and Will Smith was still writing songs.
So we developed the web app, making our interface cross-platform. But there was another problem – we had to make it cross-browser compatible. While cross-platform dealt with different operating systems, cross-browser meant the web application had to work with Internet Explorer, Firefox, Chrome, Safari, Opera, and so on.
For newer web developers, Firefox, Chrome, Safari, and Edge all tend to render pages similarly now, but this wasn’t the case of 2005. For those of you unfamiliar, the web has always been almost the wild west of software libraries. You can see this with the modern day website.
When making a new website, you need to know at least 3 different languages. You have HTML to layout the page, CSS to further advance the layout and style the page, Javascript to write code in the browser, and [usually] a different programming language on the backend to deal with server logic.
Not only that, originally CSS and Javascript were not even standardized across browsers! So developers had to program special conditions for Internet Explorer, Chrome, Firefox, and Opera. While Chrome and Firefox were far better at following this standard, eventually Internet Explorer (now Edge) caught up.
Even with all of this complexity behind the web and forming standards, it didn’t deter leaders in the web community to come together and hammer out a standard that was actually followed. It took awhile, but finally now all browsers [mostly] comply.
However…
The “App Revolution” is undoing the work the web community put in to make the internet both cross-platform and cross-browser compatible.
When Apple launched their App Store, they required a programming language known as Objective C, and then acquired a “friendlier” version known as Swift. Meanwhile, Google with the Android phone promoted Java – yep the same one mentioned above. At least Google was trying…
So while web standards were hammered out to create unified experiences, Apps started going in the exact opposite direction.
What does this mean for the developers behind your favorite websites?
Let’s say you are a developer and you make a website/webapp (like Tiingo) that is accessible from everywhere around the world, and because of the work of many experts across the web, you know your users are getting the same experience regardless of their browser or operating system when using their desktop or laptop.
But now your users are asking you to make apps for their phones and tablets. What do you do? After all they are very friendly and native ways to interact with users on the go.
Now let’s make this even worse 🙂
Some people don’t want to download your app (we’re all guilty of it), and want to google your site on their phones. Now you have to make a mobile version of your site so it looks decent on mobile phones, even if somebody isn’t using an app.
The modern day web company therefore has to do the following to be accessible on the majority of computers, phones, and tablets:
Make a desktop version of the website
Make a mobile version of the website
Make an iPhone app
Make an Android App
In order to make these apps, you have to code an entirely new front-end to communicate with iPhones, then do it again for Androids (there are some tools that help with this but they are not perfect). So now you need to know HTML, CSS, Javascript, a back-end programming language, Objective C/Swift, AND Android Java for a modern web app. This is why you see newer companies choosing either an app or a web app for their product.
But is there really a reason we have to re-create 3 mobile versions of our products? After all, shouldn’t the mobile version of the site work on all phones the same way? Given how much work was done to standardize browsers and webpage rendering?
Exactly.
This abandoning of cross-compatibility in the web has led to multiple programming teams just for mobile, which means higher costs, more overhead, and slower development. It has been a huge cost on companies and developers but luckily there are protagonists to this story.
In Part 2, we will be discussing the steps Microsoft, Google, and a few other smaller companies have been doing to unify the “App” experience.