Making the World’s Best Screener for Our Users Pt. 2
If you haven’t seen part one – read it here: Making the World’s Best Screener for Our Users
As we’ve improved our screener- we also couldn’t stand idly by not updating our custom metrics creator. Tiingo was the first major financial tech company to allow any user to create their own stock screening metric.
And as time passed – we realized we were going to make it so much better for you.
Announcing: The Sexy, Newly Revamped Custom Metrics Creator:
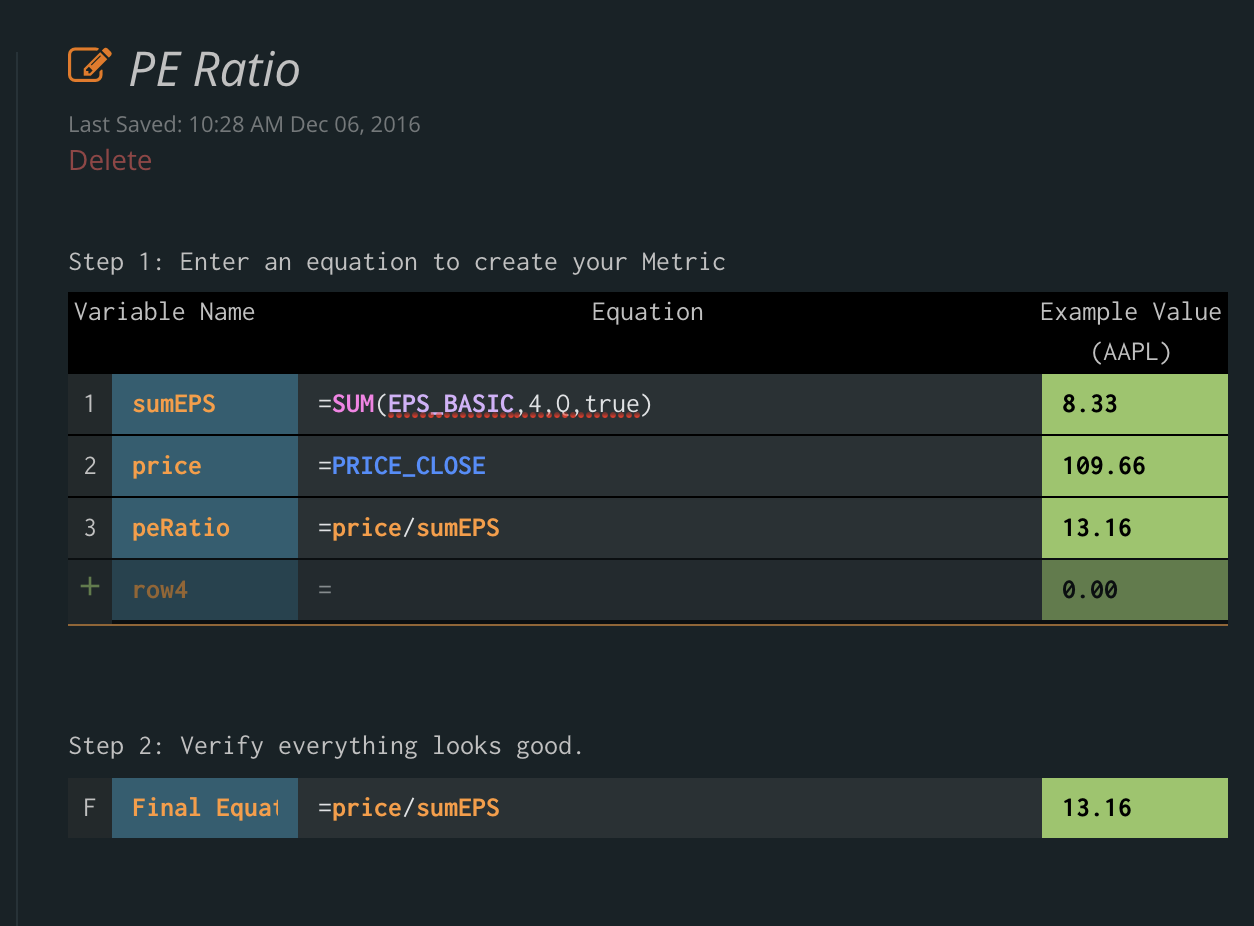
The New “IDE”
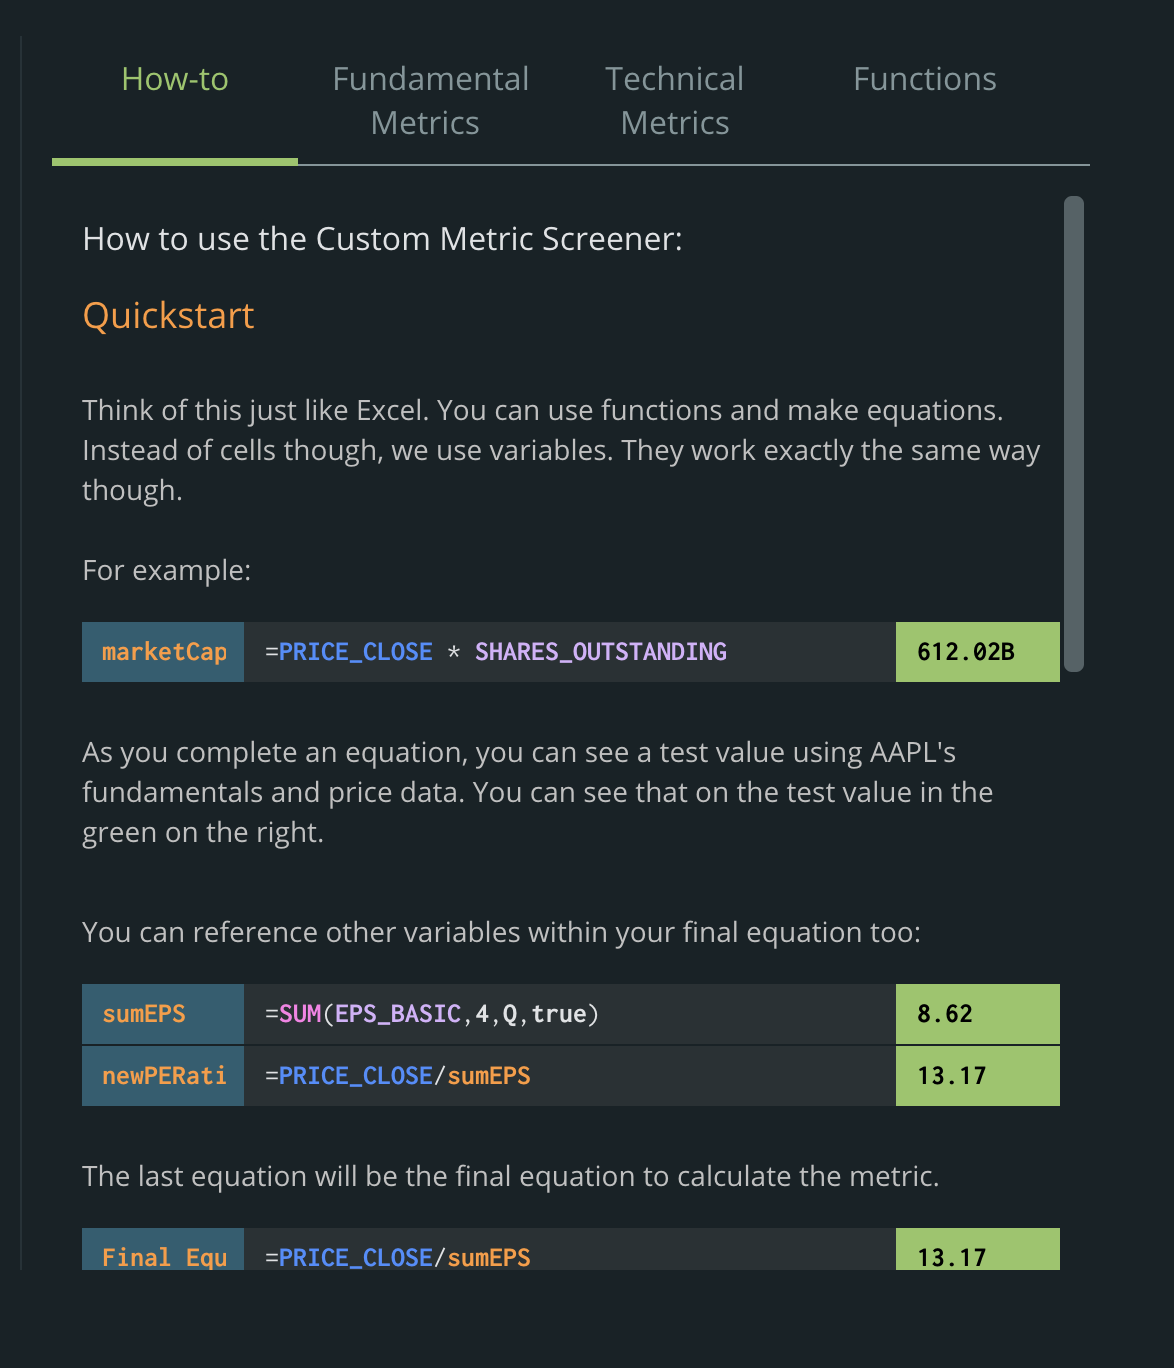
Programmers use “IDE”s to code – and we wanted to make that simple for everybody to use. We created our own version that makes it so simple – so if you know Excel, you know how to make a custom metric.
And the best part? Each line will give you the number calculated so you get feedback immediately.
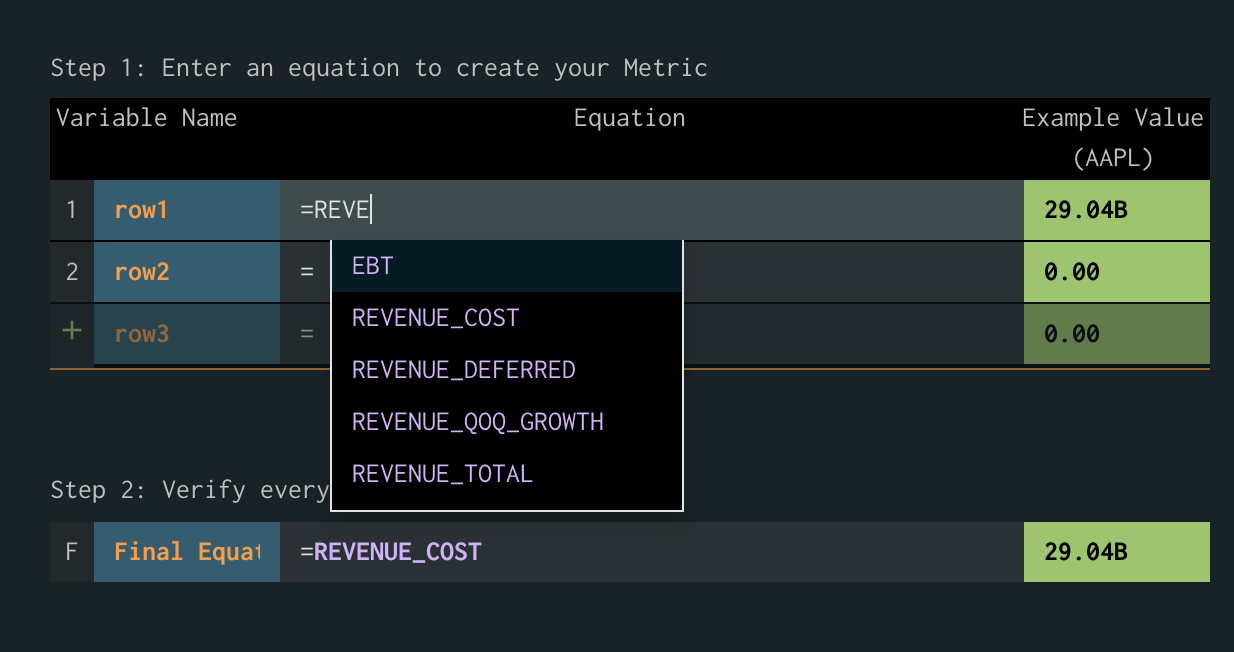
We even added autocomplete:
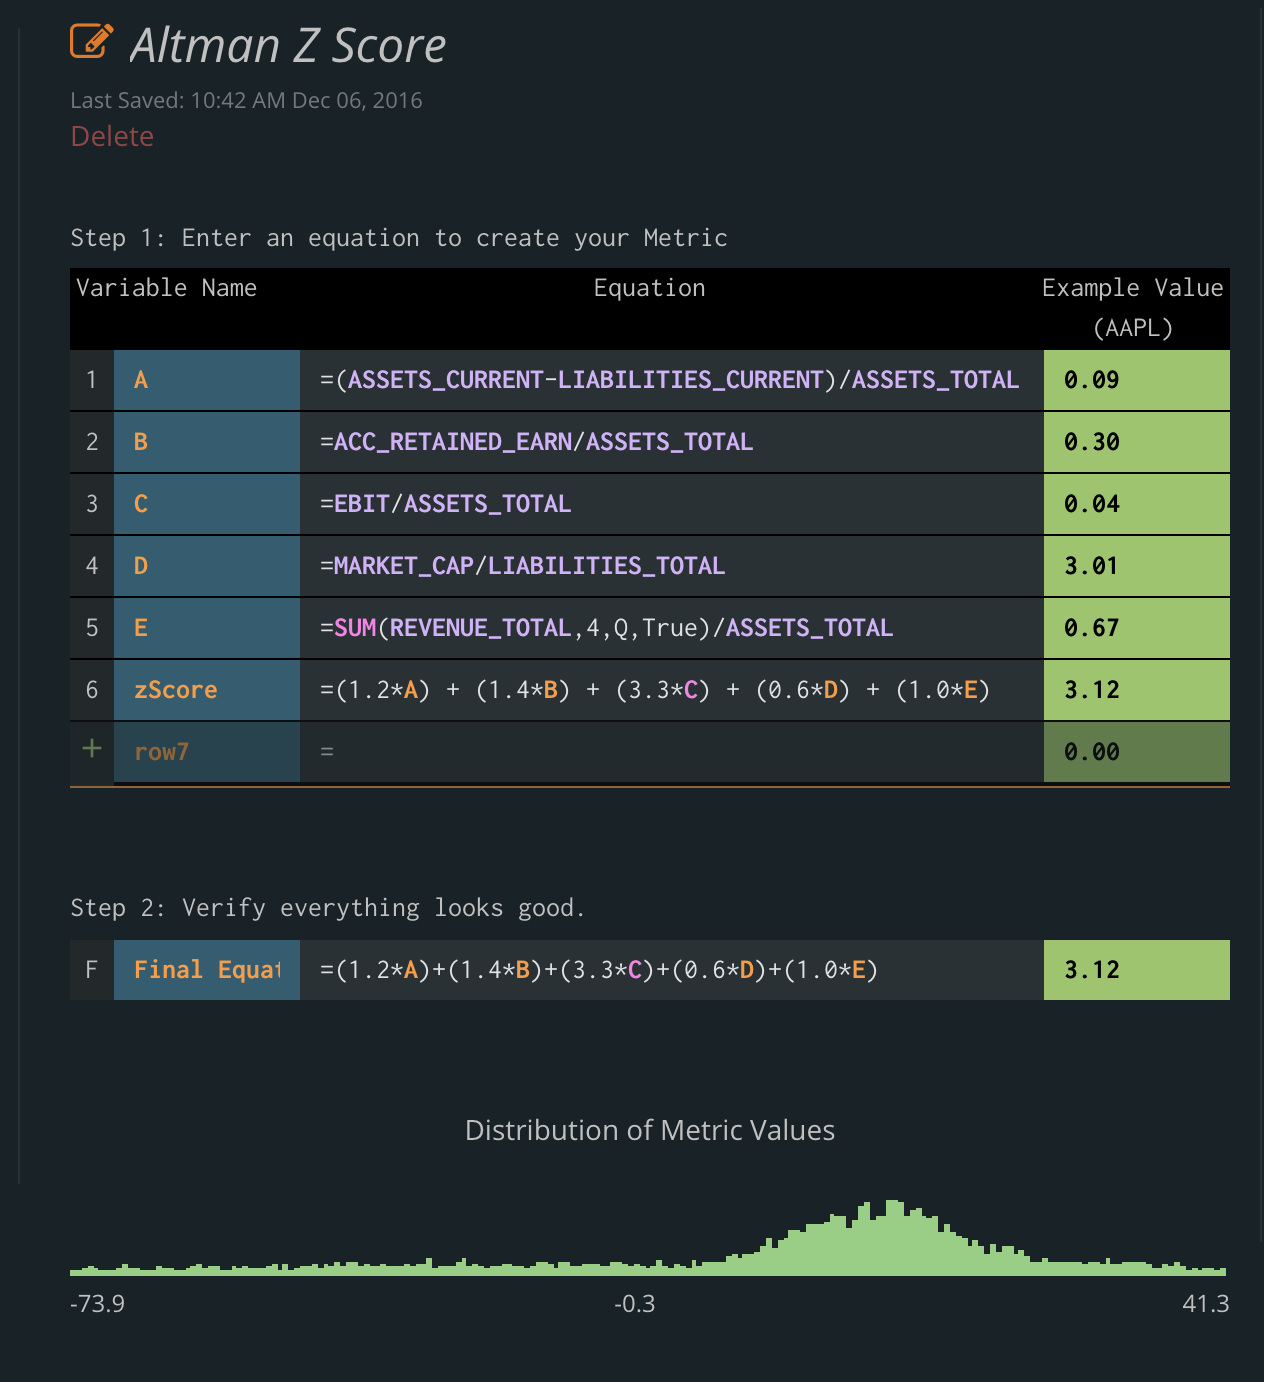
The Shifting Distribution
One of the most impressive features we’ve ever coded on Tiingo is taking your custom metric, and then calculating analytics on it immediately. The horse power this took was incredible and it pushed our coding abilities. Coding the shifting distributions, especially with custom metrics, took us 80% of our time.
As you enter your metric, you will see the distribution of your metric across the entire Tiingo Universe:
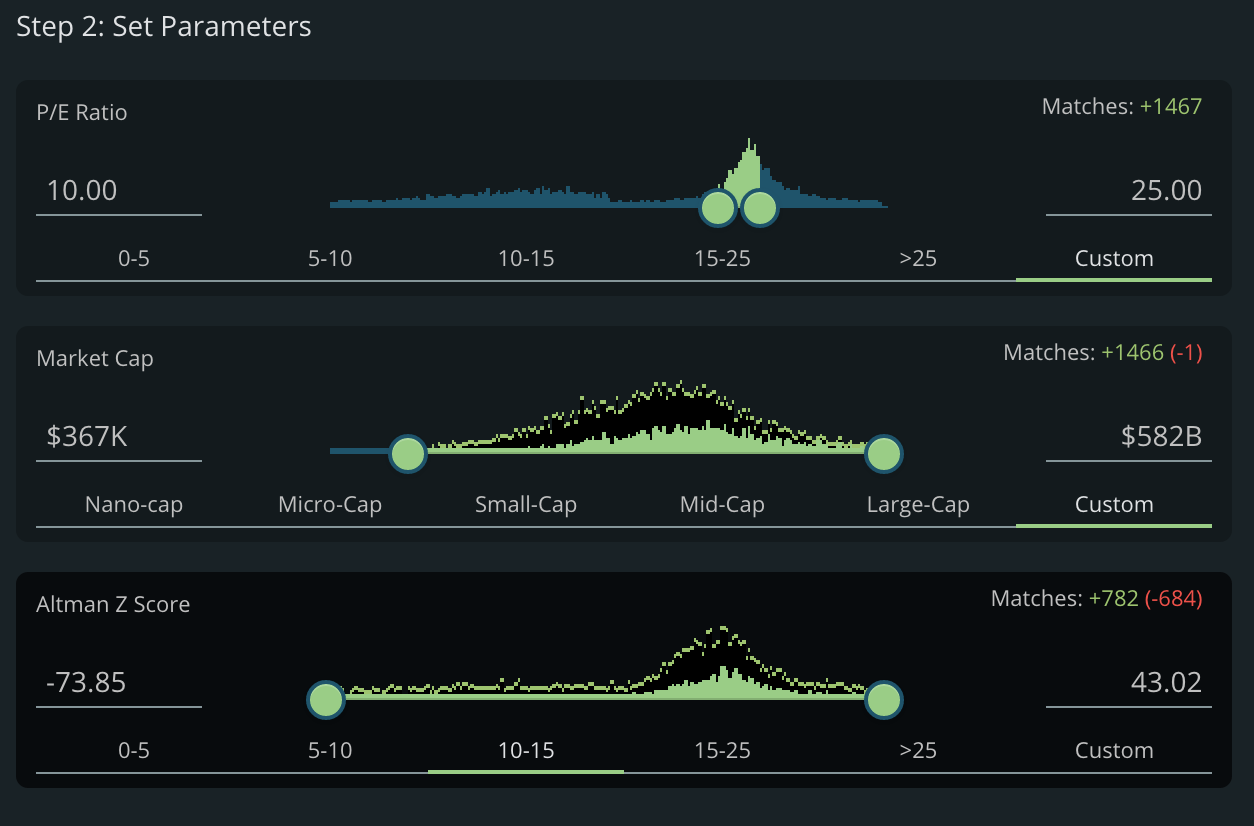
And now when you screen – just like the screener, the distribution of your metric will shift
The Docs
This blog post couldn’t cover all of the metric and functions (like calculating the mean EPS over the past two years), so we created comprehensive documentation that let’s you harness the full power of the new screener
We know you’re going to love our new Custom Metrics: Tiingo Custom Metrics
2 thoughts on “Making the World’s Best Screener for Our Users Pt. 2”
finally… clean data coupled with with enterprise-grade analytics at an honor-code entry price!
laudable accomplishment. the industry would be fortunate to have more of your mold.
My first experience of this new screener is great. Not only is it a pleasure to use because of the great looks and intuitive driving, but it also offers extremely useful functionality not found elsewhere. The correlation and beta analysis and the risk parity balancing are first steps towards building portfolios with lower volatility and higher Sharpe ratios. Whenever seeing results based upon multivariate calculations I tend to check by re-coding these on my own platforms. The outcome is that Rishi has done a wonderful job in accuracy and robustness as well.