Making the World’s Best Screener for Our Users Pt. 1
It is over a year ago Tiingo launched it’s first screener. We were attempting to move forward the power of screeners, and we had a grandiose ideas of how to do it. We were the first to:
- Allow users to create their own metrics
- Created a new UI that challenged existing assumptions of screeners
We’re never happy with the status quo, so we decided to challenge ourselves further. We were going to make the custom metrics more intuitive, the screener more informative, and the user experience so intuituve – you would have no idea that you just screened through ten million datapoints because it took 200ms.
Announcing: The Sexy, Newly Revamped Screener:
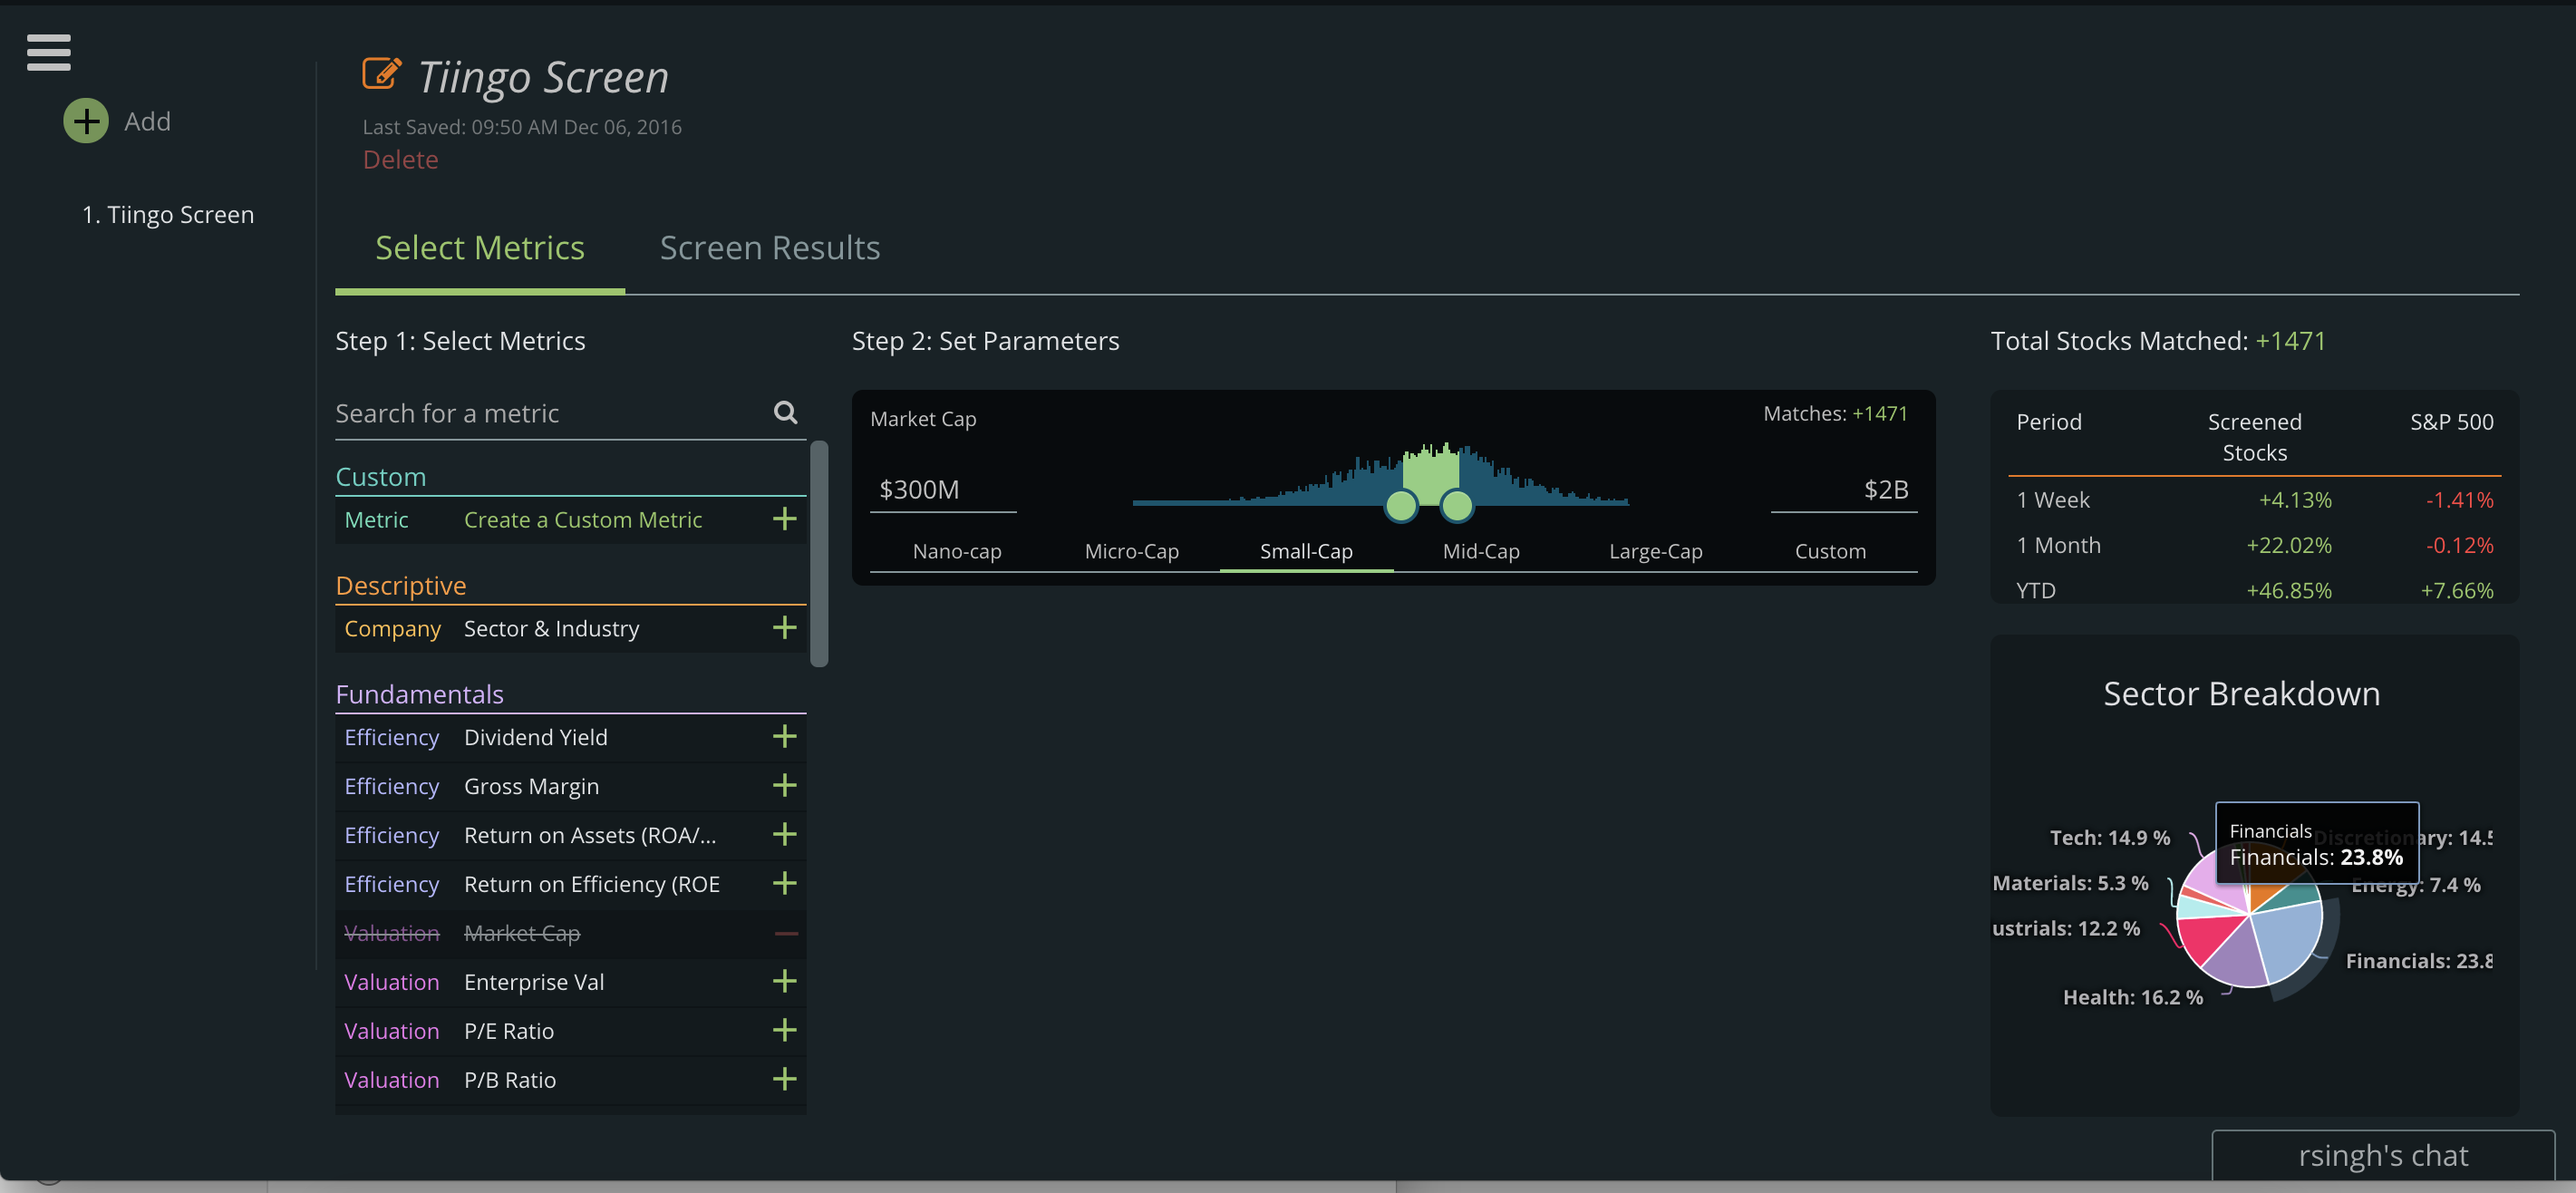
Tiingo Screener
The New Notebook
We’ve consolidated the screener overview page into a notebook format. This allows for easy switching among screens and reduces clutter while saving you clicks. We strive for beautiful minimalism here at Tiingo:
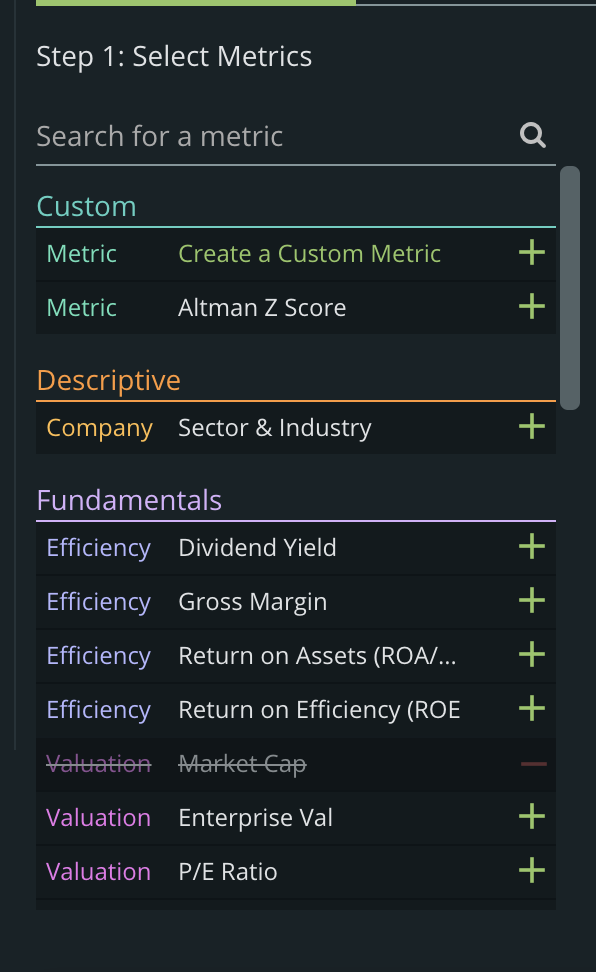
Searchable Filters
While the old drag and drop was nice, we wanted to come up with a new way to add/remove filters. We’ve created a beautiful searchable table, organized by the type of metric.
Shifting Distributions
We believe data visualization should be done with a level of minimalism. We don’t want charts for the sake of charts. And research has shown time, and a time again, less is more when conducting analysis with numbers.
So we started off with the concept that when somebody screens, they should have context.
Is a filter for a P/E Ratio between 10-25 too common?
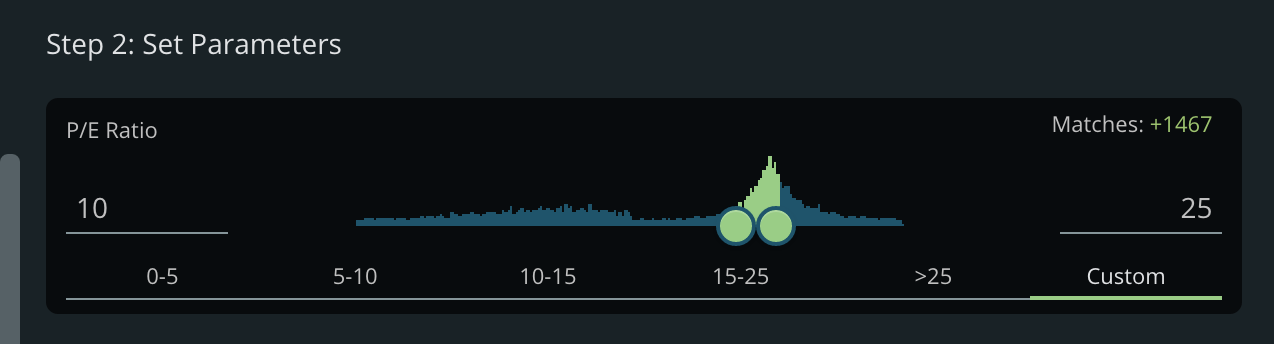
But that wasn’t enough.
If we’re looking at a PE Ratio of 10-25, what kind of companies are we choosing? Are they small-cap or large cap? The Market Cap distribution has shifted and we want to know that.
Announcing:
The Shifting Distribution
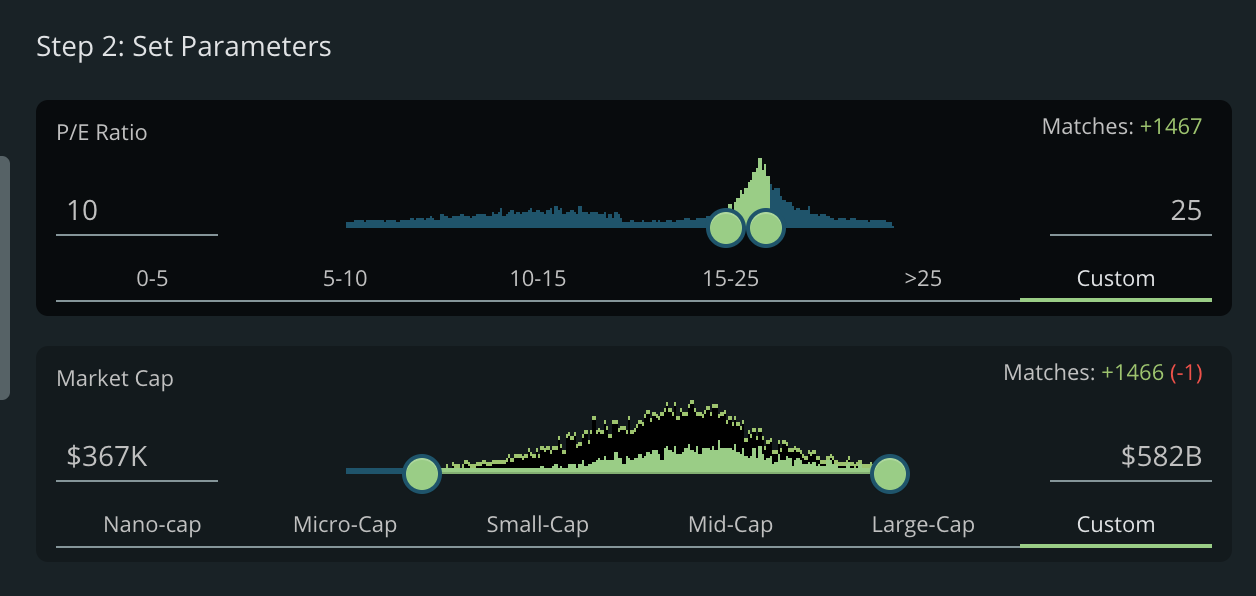
We can see that a P/E of 10-25 leans slightly toward larger companies.
How about a P/E ratio of -20-0.
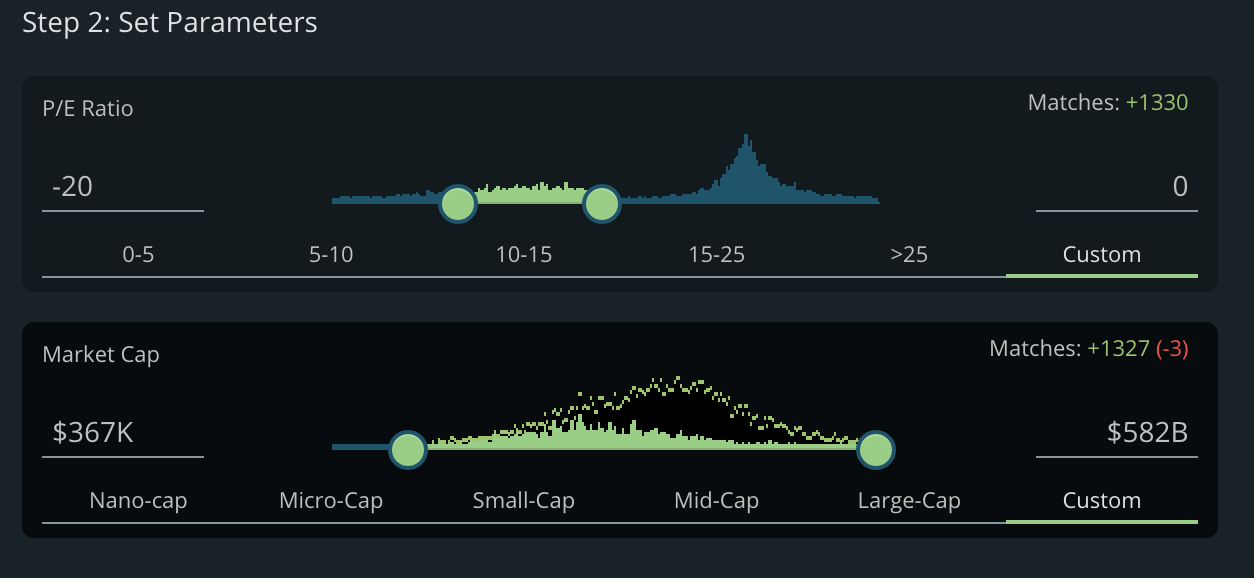
The distribution has switched largely to smaller Market Caps.
Suddenly, you now have context into all of your screening metrics. And the best part? It’s all done in a flash of a second. If you don’t believe us – check it out here (no registration required): Tiingo Screener
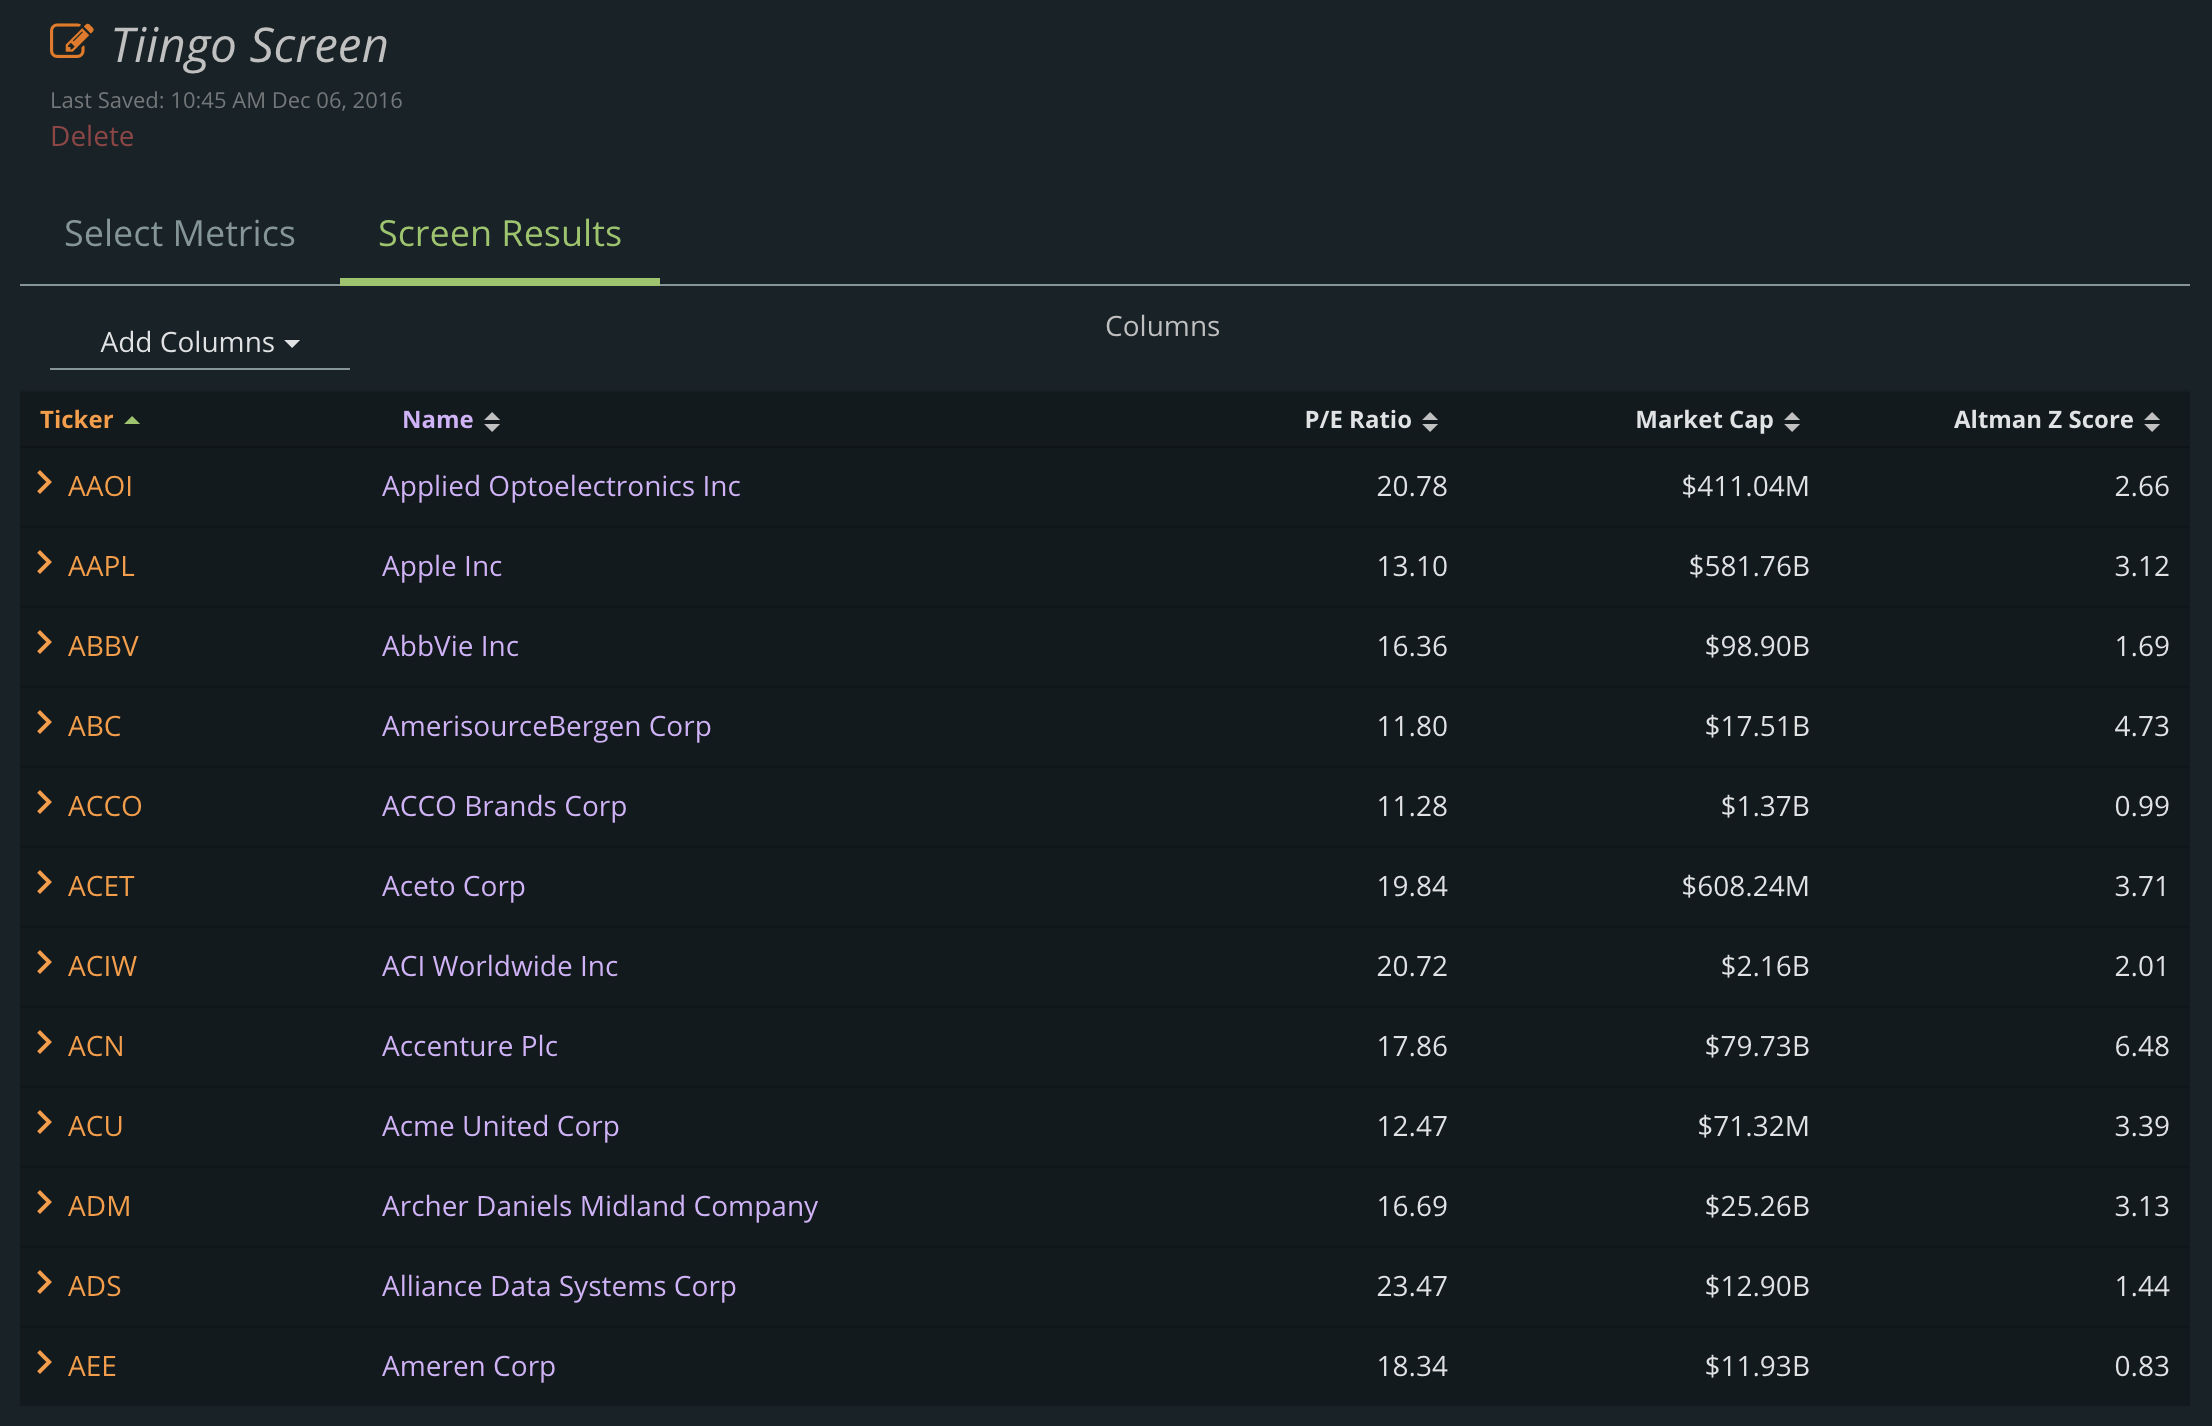
The Results
We wanted our users to be able to see the latest data – quickly. Now the results show you metrics seamlessly and beautifully:
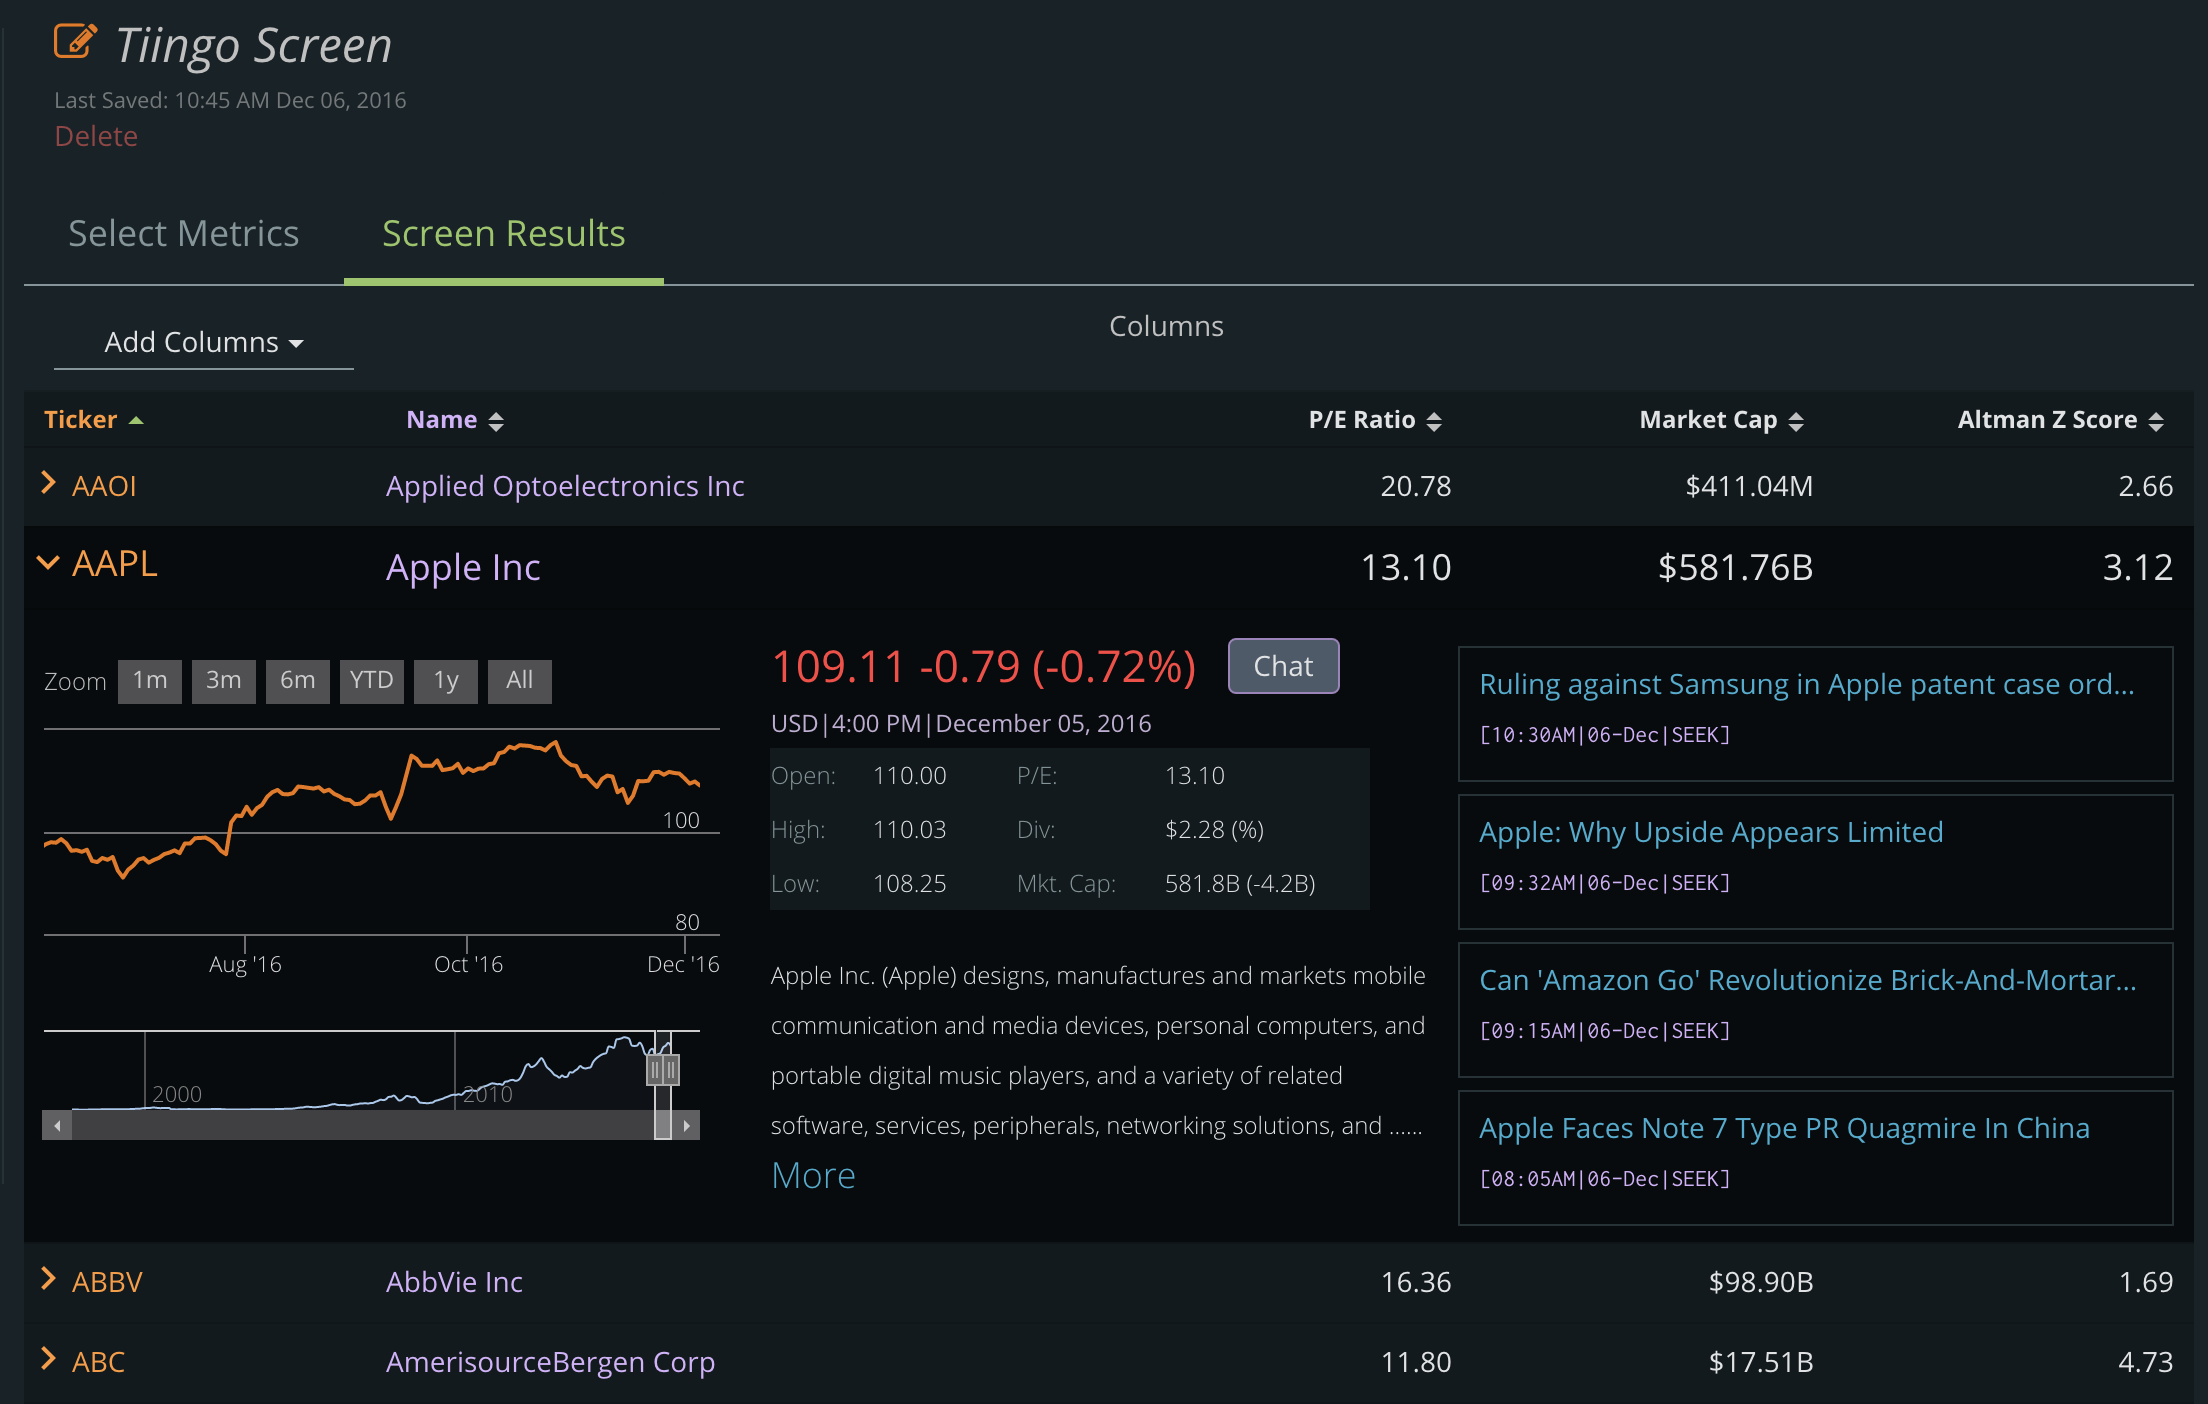
And you can simply click to see more about a company:
We know you’re going to love this new screener: Tiingo Screener