Podcast: Ep.5 I Need Stats, Stat! (Volatility and Statistics)
A new Podcast, Episode 5 was just released that breaks into what Volatility is. I was especially challenged by this topic because usually it is a topic left for later given how complex it can get. This episode took me the longest to make (it actually is the longest so far) because I had to pay attention to every detail to make sure the examples were easy-to-follow. I re-wrote the script many times and my delete key and sanity got a good workout.
With that! Here are the links. If you have iTunes please use that as it helps my rankings within the store. Don’t forget to subscribe to stay updated on future episodes!
You can find the script of this podcast at the bottom of the E-mail.
Going forward, these blog posts will have supplemental information to help in understanding the podcast. It will contain pictures, graphs, and other links that may give a stronger understanding of the topic.
Supplemental Information:
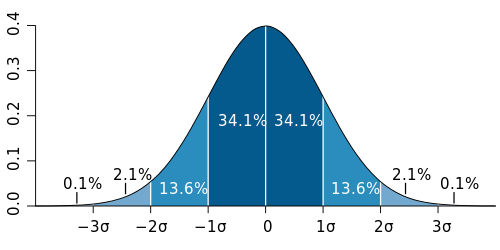
The above picture is a bell curve showing how much 1, 2, and 3 standard deviation moves represent. Notice if you add the levels together, you get the 68-95-99.7 rule.
Here is the script that was used in today’s episode.
Note: I don’t follow scripts word-for-word as they can sound unnatural, but the episodes do closely follow them.
Episode 5 – I need stats Stat!
This is episode 5, “I need stats, stat!” If you just cringed at the corniness, I promise you I did too. In fact, I cringed so hard I knew it was the perfect title. I’m finding as I get older, I’m having the same sense of humor as my dad….and I like it. I’m looking forward to the future facepalms of my kids.
Before we get started, I want to share with you all a blog I started. The url is blog.tiingo.com (spell it out). The script behind each of these podcasts will be available on the blog in additional to supplemental materials like graphs, charts, illustrations, and so on. This podcast is going to be written with the perspective that you will not need the blog to follow along. It will be helpful though to check It out after each podcast to help understand what we just talked about. It will help solidify our learning. And I also created an E-mail list that you can sign up on blog.tiingo.com or on the Podcasts page on Tiingo.com, to stay notified of new episodes, new features on Tiingo.com, or a list of interesting analysis or articles I find. I won’t send more than 1 of these E-mails a week. You can access both the blog and podcasts at Tiingo.com if you click on the top navigation bar.
So, I know these past couple episodes we’ve been getting pretty technical. I also know it can be tiring. But I promise you, I can empathize with you all. I was originally a self-taught trader and investor before I did so professionally, and I take deep consideration into both interestingness and usefulness. Is interestingness a word? Anyway, so I’m going to take something that’s incredibly useful like volatility, and make it super interesting. Will there be dinosaurs? No – but there will be me and my jokes….sooo you got that going for you….and me I suppose
Now, Traditional investing books don’t cover volatility so early on, but having been in the trading and investing world professionally, volatility and the statistics we’re going to discuss are some of the most important and talked about metrics in the industry. Entire strategies and portfolios are built around volatility. If you want to know how to manage your portfolio or how to talk to a financial advisor, volatility is going to be a fundamental metric for you.
Those of you may be wondering, “Rishi – OK – you like volatility but what is it?” Well I briefly describe it in episode 3, and let’s do a quick recap and then I will explain why it’s important.
Recap:
To explain volatility, let’s discuss an example.
Let’s say we have a portfolio of $100,000. Know, I’m saying $100,000 because it’s an easy number to work with, you don’t need that much money to invest. It’s January 1st, 2015 and you have $100,000 you just invested in the stock market. By December 31st, 2015, you have $110,000, you made $10,000 or 10% of your investment from January 2015 to December 2015.
What I didn’t tell you though, was that in June 2015, markets tanked and your $100,000 dropped 50% to $50,000. However, from June to December, markets rebounded so quickly, that your $50,000 in June ended up being $110,000. So yes, you made 10% by the end of the year, but it was an awful roller coaster. I mean imagine that! How would you feel in June? You lost half your money in 6 months and then you quickly made it all back and more.
Now let’s imagine a different scenario. January 1st of 2015 you have $100,000. By December 2015, you also have $110,000. So you also made 10% in this situation. But this time in June, your portfolio is worth $105,000. SO you made 5% rather than losing 50% in the other scenario..This steady trend continued into December, and by December, you had $110,000.
Which scenario would you prefer? Most people prefer the second, and the reason is that it’s not enough to just know the return of the portfolio. What’s also important is understanding the return of the portfolio and how it moved to get there. This is what volatility is, how much something moves.
In the first scenario, where we lose 50% then make it back, that portfolio is said to have high volatility. Because there is a lot of movement, it is very volatile. The second scenario is said to have lower volatility because there is little movement, it is not as volatile. They both in the end got to the same place, one just nearly makes us sick to our stomach though.
So then why is volatility important?
Volatility is one of the most important metrics in investing and trading, because it gives us context. It allows us to put market movements, returns, and really anything into context. When things move, volatility let’s us know if is matters.
For example, We’ve all seen the headlines, one day the DOW is down 300 points, and the next day it’s up 400 points. But how do we know if that up or down move is significant? How do we know if we should do anything to protect ourselves? Or if the stock market is just moving as it normally does? This is where volatility comes in.
By the way, as a quick asider – we discussed in episode 1, the DOW is a poor measure of the stock market – I’m just quoting headlines we typically see. So let’s now change our examples to the S&P to keep things consistent.
Let’s say the S&P was down 5% then the next day up 5%. And let’s say the third day it was up 2%. How would you feel about the 2%? You would think, “no big deal – it’s been moving up or down 5% a day” You would probably not bat another eye and continue on your day.
Now, let’s explore another example. The S&P was down 0.5%, the next day it was up 0.5%, but on the third day it was up 2%. How would you feel? It might be a little more attention grabbing this time and you will see many news channels trying to figure out what happened.
See the difference? Volatility help gives us context. It tells us how much things are currently moving, and gives us more information about if the current move matters. It helps set our expectation if a move we anticipate is within the bounds of what’s currently happening.
This is a topic that’s really important to me because it can be frustrating. A lot of financial news channels make headline stories that “the DOW lost 300 points” or whatever, but if you do a quick calculation, which I’ll teach you coming up, you may realize that the 300 points that was lost is just normal day-to-day movements. Markets naturally fluctuate, it’s what they do! We invest in them because we think they will eventually go higher, but that’s the longer-term. So you end up seeing many media companies and tv channels freaking out over a move and creating panic when there may not need to be one. And this really upsets me, because appealing to fear or euphoria is not a good way to teach people or make them feel. A better way is to express news calmly and let people discuss whether or not what happened is important, and if so why and what are ways we can navigate it.
Unfortunately, it’s not as sexy as making noise, pretty graphics, and attention-grabbing headlines about why you need to watch right now. My goal isn’t to get you to stop watching those news channels, as they can have good information sometimes, but it’s to be skeptical of them and for you to know when they are playing to our emotions. Fun fact, if you go on Tiingo.com you will notice some news articles are faded out. I have computer algorithms running that detect if a company is potentially using words to artificially emotionally play to you. And if they do, the link fades out. The stronger the fade, the more likely deceptive language could be being used. Now, like I said, the article may have good information, but it’s important to be aware that they may trying to be get an emotion out of us. The algorithms will never be perfect, but they are getting better.
Anyway, moving along.
We’ve discussed what volatility is, and why it matters. But what else?
In Episode 4, we discussed our beta and correlation are measures of portfolio diversification. Well, you can consider volatility as a measure of uncertainty there is in markets. Wait what? How does how much something move tell you about uncertain something is? Let me explain with one of my favorite desserts ever: cookies.
Anyway! Onto how volatility can reflect uncertainty
I don’t know about you, but I love cookies. One Halloween, I was cookie monster and I filled a pail of cookies to give to people because I naively thought it would be fun and nothing strange would happen. I ended up eating most of the cookies, but let’s just say some interesting characters, pun intended, asked me for some. Well the characters became more and more interesting, to put it lightly, and I soon decided it’s probably best not to carry around a pail of free cookies with you at a Halloween party. Yeahhh….
So let’s say I learn from my mistakes and now I’m now selling cookies at a cookie stand. And my cookie formula uses flour and chocolate chips. Now I buy my chocolate chips from a friend who has this weird fascination with chocolate chips and spends his days finding the best ones in terms of taste and shape. Each day, he goes to the market, buys a ton of chocolate chips, then scrutinizes each chip selecting the best. That’s my cookie’s secret ingredient: the best chocolate chips available. They taste sooooo good that everybody wants them.
Now, I’m a kind man and my cookies are so good that I want everybody to eat them. SO I sell them for a $1. I haven’t changed my cookie prices in over 10 years! My cookie prices never move, because I always know I will always be able to make them. The price of my cookies has zero volatility.
Now let’s say my weird chocolate chip friends tells me, “Hey Rishi man…so there’s a chance I go out of town for a couple months…and If I do leave to go out of town, I wont be able to provide you chocolate chips during that time. I wont know for sure if I’m going for another 2 weeks though”
NOOOOOO who will buy my cookies if I don’t have his chocolate chips????? The cookies are how I pay for things!!!!
What do I do to protect myself? Well I can’t hoard my cookies and sell them gradually because they will go stale. I have to sell them immediately. And I’m not certain if he’s going on vacation yet so if I hike up prices too much, my customers will go to somebody else. What do I do? Well I could slightly increase the price of my cookies. That way, if he does go on vacation I can still pay my bills, rent or mortgage. Sure I won’t be living large, but at least I can support myself.
There is uncertainty in our chocolate chip cookie market! We’re not sure what’s going to happen!
I think there’s a 50/50 chance he goes on vacation, so I increase prices to $1.25.
The price of cookies went from $1 to now $1.25. Now let’s say one week later he comes back to me and says, “Hey Rishi, I still haven’t figured out if I’m going on vacation.” He told me last week he may go on vacation two weeks from then. It’s now been a week and I still don’t know if he’s going on vacation soon!
Now I’m freaking out. If he goes on vacation, how do I make money for two months? My cookies are awful without those chocolate chips. I mean they are literally awful. I never used to bake.
So I increase my prices to $2. The price has fluctuated even more because there is more uncertainty and I need to protect myself!
Now my friend is 3 days away from his potential vacation and says, “Rishi, I don’t think I’m going to go on vacation, but I can’t say for sure yet”“WHEW” Well I’m not out of the woods yet, but I feel a little more certain about the future, so I drop my price to $1.50.
2 days later he tells me he wont be going on vacation and I breathe a huge sigh of relief. I realize, I need to charge more for my cookies in case he ever decides to go on vacation again and I increase my price to $1.25. I never increase my prices again from $1.25 for another 10 years.
Alright so what happened? Well for ten years I never charged anything other than a $1 for each of my cookies. So there is no volatility. The price didn’t move. But all off a sudden, as soon as there was uncertainty and I was at risk. I needed to create a cushion to protect myself and lower my risk. So I increased prices. The uncertainty and urgency increased some more, and the price fluctuated even more. I needed to protect myself! When my friend gave me more information that his vacation doesn’t look likely, there was less uncertainty so things were less at risk. When my friend finally decided not to go on vacation, there was almost no uncertainty and things were not at risk. So I went from 10 years of no volatility, to a much much higher volatility in just those 2 weeks my friend was deciding to go on vacation.
But now I decided to be smarter about the cookie business and to charge more for cookies at $1.25. Notice how volatility measures how much things move. So even though my price was higher for the next ten years, because it didn’t change, it had zero volatility. When the price changed from $1 to $1.25 in the first week, there was a ton of volatility because things were changing. At the end, when I decided $1.25 would be my price for the enxt 10 years, there was now zero volatility. See, it’s not the price that matters, it’s how much it moves.
This is an example of how volatility can be used to help measure uncertainty. Notice how the price level doesn’t tell you much about uncertainty or risk, but it’s how quickly and how much the price moves that helps us understand uncertainty.
The next question is, how do we all put it together? We know what volatility is, but with beta and correlation we could calculate an exact value.
Before we continue, I want to share a fact with you all. So I don’t know if you watch standup comedians, but a couple do bits about their favorite food and when they go perform, fans will send them their favorite food to their hotel room. It’s how fans show them how much they love them. I’m not saying you should send me cookies, that’s not what I’m getting at…but I am saying you should definitely consider it.
Calculating the values
We’ve spoken in very general terms so far with volatility. Let’s now explore how to calculate the values. To do this, first we’re going to learn some things that will be a lot of fun. I’m also going to show you how to tell if a “large market move” is actually that large.
To begin we’re gonna get really simple. What does an average really mean? We hear it all the time – oh he’s taller than average. Some people are very tall, others are very short, and before I sound like a Dr. Seuss book, I’ll stop. What average means is that if you took the height of everybody in the world, the average height would be right in middle. It is the height where half of the world is above that height, and half of the world is below the height. It is the middle height. You get the value by adding up all the heights in the world, and then dividing it by the number of people in the world.
I’m gonna switch up terminology here, and instead of average I’m going to interchange the word mean. Mean is the statistical term for what we often mean when we say average. In this podcast, average and mean will mean the same thing. Or more specifically, the type of average we’re discussing is called the arithmetic mean if we want to get more technical.
Some of you may be thinking “uhh duh Rishi it’s the average, why are we still talking about this?” but the reason I emphasis this is for two reasons:
1) we throw around average so casually, we sometimes forget what it really means
2) We’re going to use this average to get a little more advanced.
You know how I said half the world is taller than average, and half the world is shorter than average? When if you put the entire halves together – the whole population – It’s what we call a population.
Now let’s close our eyes, unless you’re listening to this while driving, and imagine the entire world. All 7 billion people as of March 2015. Do you picture it? I don’t because 7 billion people Is a lot. But I am picturing a lot of people.
Well, let’s say the we have the middle height. Half of the world is taller than it and half of the world is shorter than it. Now let’s focus on one of the halves, how about the tall half.
Think of how many people you know who are 6 foot? Now tell me how many people you think are 6’4? Then 6’8, 7’ and then 7’5. As the heights get taller, there are less people who have that height. The same is on the shorter side. We tend to know more people who are closer to the average height, then very very tall or very very short. So if you picture this on a graph, where you see heights on the bottom axis, and number of people who have that height on the vertical axis, you see that the majority of people have heights around the middle – or the average. As you go taller, less and less people have the same height. And as you go shorter and short, less and less people have express that height.
This graph we’re picturing is called the bell curve.
Don’t worry, we’re so close to getting into how we calculate volatility!
Let’s change our example from heights now into returns of the market. Price returns of a stock or ETF tends to follow a similar type of distribution as heights do, it’s formally called a normal distribution. Now stocks, do not exactly follow this, but in order to simplify things, we are going to assume they do.
Like heights, there tends to be an average return. In our examples, let’s assume the average return is close to 1%. This is very very high, but it’s going to help make our calculation easier. Half of the daily returns of a stock, let’s use an S&P ETF – spy for now, is less than the avg return and the other half is greater than the avg return. And just like heights, the larger the return from the average, the less common it is. And the smaller the return from the average, the less like it is.
Wouldn’t it be cool to look at how much a stock has moved and determine if it’s significant?
Well to figure this out, we need to calculate a metric called variance.
Before continuing forward, know that this may take a couple listens to get through. If you don’t have a pen and paper, that’s fine because I’m going to talk more about the intuition behind the formula. You can always look up a formula on the internet, it’s the concept behind a formula that makes it so powerful. This concept took me a lot of struggling to eventually get down, and I want to explain it in a way that makes it easy as possible. If you just want to know the jist of how we use volatility and the like, that’s fine too. Just bear with me for five or so minutes while I get a bit technical. We will get back into the conversational style right after. You don’t have to understand the concepts to know how to tell if a market move is significant, but I highly highly recommend it. Either way, after we explain the concepts of what is volatility, we will go into using it in a relevant way to judge if a price movement matters.
Here we go!
Variance simply measures the average distance returns are from their mean. For ex. We know 1% is our average return the example we just mentioned. Some days we may have a 5% return in the S&P and other days maybe a -2% return. So what we would do is take, 5% and subtract 1%, so we know the 5% is 4% away from the average.
Let’s do the same with the down 2% day. We take -2% – 1% and get -3%. So we see the distance of the -2% is -3% away. Now keep in mind, we want to measure distance, so we want our numbers to be positive. If your neighbor was looking for his keys that dropped, and it was behind him, you wouldn’t say, “go negative three feet.” You would say, “Go back 3 feet”
In the same way, let’s not say -2% is -3% away from 1%. Let’s say, -2% is 3% to left of 1%.
We want to make the negative numbers positive. One way we can make al the numbers positive to square them. Or multiply a value by itself. So we take the distance and we square them. So -2 is -3% away from the average return of 1%. Let’s square that -3%, -3*-3, and we get positive 9. In the same way, the 5% return is 4% away from the average of 1%. We take the 4% and square it, 4*4. That’s 16.
Now we want to add all of these positive squared values up and take the average. This gives us a metric we call variance!
So for each return we subtract the mean and we square that difference. Then we take the average of all of those squared differences. Boom, variance.
Well guess what? If we take the square root of this value called the variance, we get a measure called standard deviation, OTHERWISE KNOWN AS VOLATILITY. WHAT. What just happened
A quick aside, a few very quant heavy people may say, a volatility calculation is different than standard deviation. They aren’t wrong, technically, but for the average investor, the difference is so small, it probably wont ever matter. There are a couple ways to calculate volatility, but this is one of the most common.
Okay Rishi, we now know how to calculate volatility. But who cares? What practical application does it have? We still don’t know if a 5% move matters. I’m getting there don’t worry.
For the next step, you need to remember 3 numbers. 68, 95, 99.7. Again 68-95, 99.7. Memorized? Cool ok let’s use those numbers!
Standard deviation, otherwise known as volatility for this podcast, is a measure of how far something is from the average. In the coming examples we’re going to say the mean return of SPY is 1% and the standard deviation, or volatility, is 2%.
Saying something is within 1 standard deviation, means we take the mean and add and subtract the standard deviation. So 1% – 2% and 1%+2%. That gives us -1% and 3%. Returns between -1% and 3% are said to be within 1 standard deviation. Approximately 68% of returns are within 1 standard deviation.
If something is two standard deviations we take the standard dev., or volatility, multiply it by 2 and add and subtract that. So 1 std deviation is 2%, so 2 std deviation is 4%. We do the same thing, we take the mean then subtract 2 std dev and add 2 std dev. This gives us 1%-4% and 1%+4% which is -3%-5%. Returns between -3% and 5% are said to be within 2 standard deviations. Approximately 95% of returns are within 2 standard deviations. That means 5 % of the time, it’s perfectly acceptable for returns to be greater or larger than that value. That’s approximiately 12 days a year.
If something is three standard deviations we take the standard dev., or volatility, multiply it by 3 and add and subtract that. So 1 std deviation is 2% and 3 std dev is 6%. 2% *3 std dev. We do the same thing, we take the mean then add 3 std dev and subtract 3 std dev. This gives us 1%-6% and 1%+6% which is -5%-7%. Returns between -5% and 7% are said to be within 3 standard deviations. And you may have guessed it, approximately 99.7% of returns are within 3 standard deviatiosn. So .3% of the time, it’s not unreasonable for a return to be outside those values – that can happen 2-3 times a year.
That’s why 68, 95 and 99.7 were so important to memorize.
Okay now let’s make this real world.
In the above examples, we said the average return of the S&P was 1% and the volatility was 2%. In reality, the average daily return of the S&P is close to 0% and the standard deviation is close to 1% This is the very long run average, from the 1950s. In episode 4 we talk about how beta and correlations can constantly change, and the same is true for volatility too. During 2008 for example, volatility levels were much higher than they have been in 2014. So like correlation, volatility also changes throughout time.
Believe it or not, you can actually trade volatility, or the standard deviation. It’s a statistical measure. And not only this, there is even an index that measures the volatility of the S&P. How meta is that? I mean not only is the S&P an index, but there is an index that measures the volatility of another index! This volatility index is known as the VIX Index. So if you look up the value of the VIX, on your favorite financial website, you will as of today, March 23rd 2015, the value is around 13.5. When you’re looking at what the market is pricing in, it’s generally better to look at the value of the VIX for the previous close. This is because if a market makes a big move, the VIX will often increase. SO if you’re checking to see if the current market move can be considered important, you want to know what traders were pricing in BEFORE it happened, not after the event happened. So the previous day was March 20th, a Friday. The value then was 13.
You may be thinking, “WHOA 1 standard deviation is 13%??” And the answer is sort of. That number is an annualized number, meaning that’s the volatility of the return of the ENTIRE year. We probably care more about the volatility for daily returns. After all, in the above examples we all used daily returns.
So to turn that 13% into a daily number do this: divide it by the square root of 252. 252 represents the # of business days in a year. Okay the sqrt(252) is approximately 15.9. Dividing the VIX value of 13 by 15.9 gives us 0.82%. That is a 1 standard deviation move for the S&P according to volatility traders right now. There are some more sublties but for all intents and purposes, this is a good approximation.
Now treat the VIX like a stock price: it can be wrong. It’s an index of what traders consider to be the volatility level. In reality though, traders can be very wrong.
So taking the avg daily S&P return to be approximately 0, we know 1 standard deviation is between -.82% and +.82%. so 68% of the time it falls in that value. In 2 standard deviations, 95% of the time the value will be between -1.64%$ and 1.64%. and in 3 std deviation values, it will be -2.46% and +2.46%.