Browsed by
Tag: stocks

Podcast: Ep.6 The Different Styles of Top Investors and Traders (Value, Growth, Discretionary, and Quantitative)

Podcast: Ep.6 The Different Styles of Top Investors and Traders (Value, Growth, Discretionary, and Quantitative)

Many of us have heard of the big name investors and traders out there, but what makes them different? What styles do they use? How do they approach markets? What separates the best from the good? This episode is an intro into the different type of investing and trading styles, so you can find one that best suits you. This will help separate some of the confusion when you see “value” and “growth” funds or when reading about discretionary and quantitative traders. We conclude with a discussion about how the top traders approach markets.

With that! Here are the links. If you have iTunes please use that as it helps my rankings within the store. Don’t forget to subscribe to stay updated on future episodes!

iTunes Link

Non-Itunes (tiingo.com)

You can find the script of this podcast at the bottom of the E-mail.

Supplemental Information:

Courtesy of http://independent-stock-investing.com

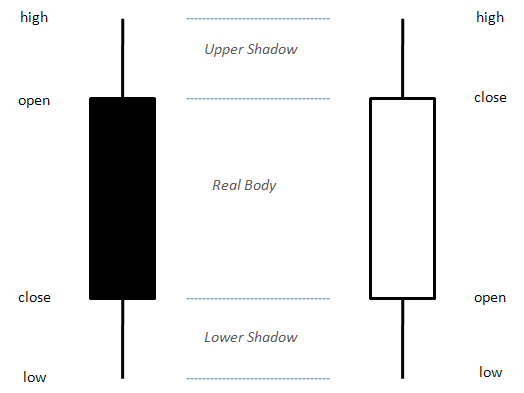
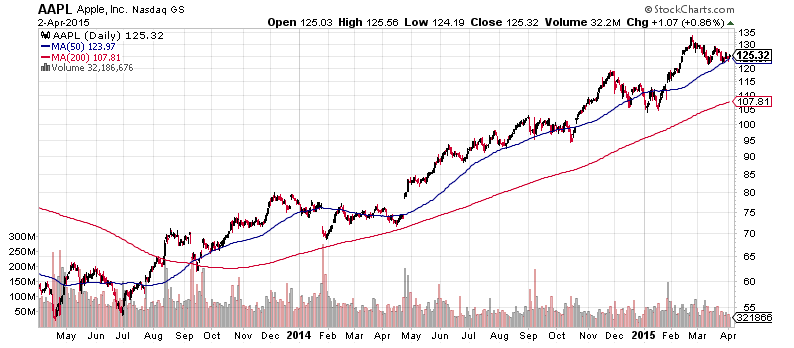
The picture above shows an example of what a candlestick is when looking at prices on a stock chart. The chart below uses candlesticks when showing the prices of AAPL


AAPL SMA 50 crossover with SMA 200
Courtesy of http://stockcharts.com

The picture above shows the simple moving average technical indicator. It’s a rolling average of the past 50 days and 200 days (SMA 50 and SMA 200 respectively).  The SMA 50 is in blue and is quicker to react to recent price changes. The SMA 200 is in red and is a longer-term indicator so it is slower to react to recent price changes.


Here is the script that was used in today’s episode.

Note: I don’t follow scripts word-for-word as they can sound unnatural, but the episodes do closely follow them.


How many types of investing and trading are there??

Welcome listeners to episode 6.  Have you ever wondered what people mean when they say, “I’m a value investor.” or “I use technical analysis?” Some might say, “I’m a momentum trader” or “I trade special situations.” For my regular listeners, you know I’m not just going to define things, that’d be too easy, but I’m going to expand upon them, give some of my experiences, and shed some light on different perspectives.   This is going to be important if you have an interest in picking stocks or even mutual funds, index funds, and ETFs. Many different financial products advertise themselves as using particular type of investing or trading style.  And as usual, you can see the script of this podcast online at blog.tiingo.com if you want to follow along.

Before I begin there is one thing I need to discuss. You can skip over the next few minutes if you decide, but given how much time we put into this podcast, both us creating it and you listening, it would mean a ton to me if you could listen to the next few minutes.

I left my job trading professionally a year ago, I didn’t know what I  wanted to do. Strange, right? I left a great job where I was doing well, the first employee of a hedge fund that grew 5 fold in a year, and on a whim I left. Well, I didn’t really leave on a whim. The reason I left is that something inside of me wanted to do more. Over the past few years, I saw many people lose money to misinformation. I mean it’s nobody’s fault. It’s strange isn’t it? Our whole lives we learn things like writing and science, but nobody teaches us finance. Then, suddenly when we get our first job in our 20s or 30s, everybody is telling us to invest it. For those of us fortunate enough to have 401ks or be able to contribute to IRAs, suddenly it’s people telling you “put this in mutual funds! or put this in index funds!” But wait, who taught us any of this???

This would be like never taking a history class from 1st grade through high school, then the day after graduation saying “write a paper outlining the American Revolutionary war.” Wait, what? This is what financial education is today – non-exist.  And this is where Tiingo has stepped in fill the gap.

This podcast promote education and financial literacy. And not just the basics, soon this podcast is going to touch upon very advanced stuff, but I promise you will be able to follow along. Alongside this, I built tools that allow people to use this education to better their portfolios. I continue to build them and I find more and more users are using them are listening to this podcast.

Tiingo’s intention has always been to help people. I always figured monetizing it would figure itself out. But the reality is, I’ve spent the past year building Tiingo and this podcast out of my own savings, and for this to continue I simply ask you pay what you feel. Even if it’s $2 dollars a month, less than the cost of a cup of coffee…or $5 the cost of a latte. Whatever you feel is appropriate or can afford to pay, I ask that you do so I can continue this.  You can do so at Tiingo.com/support. That’s t-i-i-n-g-o.com forward slash support.  The tools are will be free so if you can’t afford or don’t want to pay, still feel free to use the site. I don’t believe in showing partiality between those who can pay and those who can’t.  You will always know your situation better than I. But, Tiingo’s mantra is “Actively be good.” A famous mantra in tech by Google is, “don’t be evil.” But the financial sector needs to be stronger than that. We’ve violated the trust of people, and because of that, the mantra for Tiingo is always going to be more active, so we have the mantra as “Actively be good.”

So like I said, if you want to support the Tiingo mission, community, web app, or podcast, please consider paying what you feel at http://tiingo.com/support.

With my heartfelt message aside, let’s get into some investing and trading fun! Woo Woo!

So you’re now thinking, “Rishi I think I got the basics down and some more…but what else is there.” This is the perfect podcast episode for you. We’re going to discuss the differences between investors and traders and then dig into the different styles. There are many ways to make money in markets, and you often see the news media discussing certain individuals. A lot of these individuals tend to stick to  a particular type of trading or investing. For example, Warren Buffett is the most well-known, and richest value investor –a term we will explore later.

This way, if a professional trader or investor recommends a stock, you will have a better idea where they’re coming from. This will be important as some of you may hear a trading or investing style and be put off by it. It’s interesting how the way you invest or trade reflects personality sometimes.  You have those who are very relaxed long-term, then others who are constantly moving and taking action.

To begin, let’s go ahead and start off with the basics – what is the difference between an investor and trader. Once we do that, we’ll start getting into a lot of the different kinds that exist and taking it to a further level than your traditional book. As usual, we will always start with the basics and build our way into mind-blowing stuff. Just a heads up, I’ve spent a lot of time thinking about this topic. It’s sort of a philosophy I hold, so you may find these definitions different than what other sites say. I will explain why I think the ones presented here may be a more accurate representation.

The traditional thought is that investors are long-term buy and holders. They are in a company because it is fundamentally a solid company. What I mean by that, is that each publicly traded company is required to publish accounting statement. What investors often do, is that they consider the company’s business prospects, and the sector they are in, then they look at the account statements to verify the company has solid business prospects. They consider them stakeholders in the company and typically have time horizons 5 or more years out. They don’t worry so much about the next month or so, unless something drastic happens, but expect the company to outperform in the long run.

What does this all mean? Investors treat companies they get in like a business. Let’s say one of your work colleagues comes to you and says, “Hey I want to start a restaurant business, lemme get some of your money.” I’m not sure about you, but if one of my work colleagues, whos been a programmer his whole life tells me he wants to start a restaurant I’m not gonna give him  money off the bat. I would want to make sure what he brings for lunch looks delicious first of all.

Ha, no but in all seriousness, while you may know the individual, if he asked you to become a partner and own 50% of the restaurant, you would start making sure it was a good investment. You may look at where the restaurant is, what it sells, how good the food is, whether or not it’s in a good location, and so on.  You would want to make sure that it’s a good business. You may even want to look over the balance sheet of his other restaurants to make sure there was no fraud in the past and so on. This is how an investor sees a business.


Sometimes it can be tough for us to conceptualize because we’re so used to seeing prices on a screen and trading on them, we don’t really think about the accounting behind the firm or its prospects.  Warren Buffet is the most well-known example of a long-term investor. When he puts money into a company, he doesn’t have an end date.

Now most of us may be thinking, “well of course, when Warren Buffet buys shares he ends up owning a huge percent of the company.” While that’s true, and companies sometimes hook him up with favorable deals because of his reputation, that doesn’t mean we shouldn’t take his same perspective.  When you buy shares, you are owning a business. It’s a fact and it’s an awesome concept.

Now there is one thing that can make owning shares better than investing in your friends restaurant. And that’s the concept of liquidity. Liquidity is a financial term that means being able to convert any asset you own, stocks, a house, even your laptop, into cash.  Your laptop may be less liquid, as well as your house, but stocks can be seen as very liquid most of the time. You can simply go to your stock broker, sell your shares, and viola you no longer own the business (once the transaction clears). Try doing that with your friend’s business! To recap, investors treat buying shares as owning an actual company.

Also just a quick aside: I said stocks are liquid most of the time. Sometimes they are not if there aren’t many shares issued, or if volatility is high. During times of panic, liquidity can fall because people are not sure what to do. Uncertainty can reflect itself in volatility, as mentioned in the last episode, and also result in lower liquidity.

Okay onto traders:

We are now about to enter some blurred lines between investors and traders.  Sometimes there is no clear cut definition and I’m going to try my best to show why. Technically, when an investor buys or sells shares, they are trading stocks, ETFs, mutual funds, or so on. This is why it gets confusing. Technically a trader is somebody who trades an asset. But this is a technical definition and isn’t really helpful to us when we’re trying to learn about different styles.

When you hear trader in the media, it means something different than the technical definition. And this is the type of trader we’re going to talk about going forward.

A trader looks at a stock as something that has a defined end date. When they enter a position, they have a clearly defined rule for when they get out. Some of my listeners may claim that this is a pretty strict definition of a trader. A lot of long-term investors have criteria for when they will get out of a stock or investment. And this is true, but here is where I will argue the difference lies: a trader trades a position with the intention of them knowing they will get out eventually. An investor enters a position without the intention of getting out, but they accept as a business changes it may no longer be a good investment.

I know you may be wondering what the difference is, and this is why the definitions can be so blurry.
Let’s say your friend who wants to open a restaurant checks out. He is an amazing chef. He found a way to put chocolate on a savory pizza and make it the best thing you’ve ever eaten. Wow, I just cringed at that, but I’m sure somebodys done it.

Anyway, when you’re giving money to your friend as an investor, you’re not thinking, “Ok I’ll give him money, make a ton of money, and get out like a year from now.” You may think, “Ok I’ll give him money, his business idea seems legit, and I think he will be successful. If he isn’t successful, or if he goes off the deep end, I’ll re-evaluate and may pull my money out.”

If you were a trader, you might think, “Okay the quirky  pizza market is so hot right now. It’s like the new up and coming food, like what artisan cupcakes once were. I’m gonna give him money, and pull out 2 years from now when I think the quirky pizza market will top. Then I’ll make the most amount of money”

That’s the difference – the intention of you as a shareholder! One sees it has a business opportunity, and the other sees it as an opportunity to express a viewpoint you have

Here’s why the intention matters so much: it’s really the only way to separate the two. Some traders look at companies balance sheets, some hold positions for more than a year. Traders are often typecast as individuals who are in and out of positions very quickly.  But such a huge variety of styles exist, that I’m putting forth an idea that what really separates a trader from an investor is their intention when they place a trade. One sees it as a business, and the other sees it as an opportunity to capture a recent view they have on markets.

With the differences established, let’s move forward:

Let’s discuss the different types of investing. This is gonna be fun. So many of us read about these amazing investors, but what we often don’t hear is the styles of traders.  As I said earlier, there are so many different styles that reflect different personalities. In this episode, we’re going to describe some of the most common because a lot of mutual funds and ETFs were created to try and replicate these styles.

The first thing we will explore is one of the most common: value-investing.

The most famous value investor is Warren Buffet. The premise behind this style is that you think a company is undervalued.  For some reason, the market is undervaluing this company. This is because you looked at the account sheets, otherwise known as doing fundamental analysis. This is often combined with something else, but before we move onto that something else, I will explain a common concept value investors use.

And that is the book value. The book value is what a company is worth if you take the assets and subtract the liabilities. What I mean by that is imagine everything a company owns. The building, the computers, the technology, the patents, how much cash it has, what investments it has (like stocks), and so on. These are the company’s assets. Now thing of all the loans it owns, who it needs to pay money to and so on. Those are the liabilities. So if you take all those assets, and subtract the liabilities, you get how much the company is worth according to its books, or the book value. So if a company has $200mm worth of assets, and a $40mm loan, its book value is $200mm – $40mm which gives $160mm. That number, the $160mm is the book value of the company.  So now that we know what the value of the company is from an accounting standpoint, or the books standpoint, we need to see what the market thinks it’s worth.

So we have to calculate something called the price/book ratio. First, since a company is broken up into many different pieces, or shares, we take the book value and divide it by the number of shares. So our book value was $160mm, and let’s say the company is broken up into 1,000,000 shares. That means each share represents $160 of book value. In other words:  If the company is worth $160mm according to the accounting statements, and there are 1,000,000 pieces, then each piece is worth $160.

Next, we can see how much the market prices each share. For that, all we have to do is look up the stock price. So let’s say the stock price is $80/share. Whoa! If we closed down the company, sold off all its assets, paid its loan, we would have $160 a share! Yet the market is only selling it for $80/share! A value investor might immediately buy the stock because they think, “Once the market realizes how undervalued it is, other investors and traders will buy a ton and the price will get to $160/share.”

A common metric to look at is the price/book ratio. You take the market price of the stock, divide it by the book value per share, and that gives you the price to book ratio. In this example, it would be $80/share divided by $160 book value per share. This creates a price/book ratio of 0.5.

This situation vey rarely happens. Typically you see price/book ratios of 2 or greater. But let’s say you do see a P/B ratio of 0.5. Typically this will happen if there is something else the market thinks will happen. An accounting statement is typically released once a quarter, or once every 3 months. In those 3 months, something could drastically change. For example let’s say we’re an oil company and we make a lot of money from selling oil. What if in the past 3 months, Oil dropped from $100/barrel to $50/barrel? Well our business would probably be worth less, so the market is taking that into consideration. The accounting statements wont take that into consideration until the next time they’re released.  This is often referred to as lagging data.

SO if you are seeing a P/B ratio of less than one, be skeptical. It could be the case that everything is okay, or you think it’s still undervalued, maybe not as much as the P/B tells you, but maybe the market overreacted. And this is the job of the value investor. To not only look for things that are undervalued, but also to figure out why, and whether or not those considerations make it less attractive.

P/B is just one metric value investors look at. We will cover more metrics and what these accounting statements mean in a future episode.  There are text books written on this topic, and given the limitations of this podcast, we can’t properly cover the topic in one episode. But this is the basic idea behind value investing. You buy things that are undervalued, or in other words, you buy things that are undervalued.

A major drawback to value investing is that you assume the stock price will eventually accurately reflect what your think it’s worth. Often times, stocks may not do that or the price comes down even lower. Sometimes the markets, or other investors, have their own train of thought. Also in a crises period, something may look cheap, but because of panic selling, correlation among stocks becomes higher. In other words, the stocks move up and down together regardless of how good or cheap a company is. Especially during those times, buying something that’s a value could mean the stock continues to go lower because of issues outside the company, like a recession. So always be careful if something looks cheap. Ask yourself why? There may be a reason why the rest of the market thinks the company is worth much less than our personal analysis may show.

The next type of common investing is called growth investing:

Growth investing is a type of investing where you expect a company to rapidly grow in earnings or the potential for future earnings. The premise is easy to understand, but implementing it is a very difficult idea. Many different investors have their own type or measure of criteria for detecting what makes a rapid growth stock, but the general consensus is that you expect the stock’s earnings to grow at 12% or higher a year. Often times if a stock is growing too rapidly though, it could mean management may be getting to aggressive or reckless. They could be taking a lot of loans to achieve that earnings growth.

Everything in moderation.

The biggest issue with growth stocks is that we just can’t predict the future. How do we know a company is going to continue growing? What if people stop liking it or it falls short of expectation? When we think something continues growing, we often have to consider a lot of assumptions have to be made to make that prediction.

For example, if our friends pizza place turns out to be growing rapidly, everybody loves chocolate savory pizza, then our friend may continue to grow. We are excited because at this rate we will be so rich! But wait, what if this pizza has tons and tons of gluten and suddenly the entire town goes gluten free? Your friend tries making a gluten free crust, but it just doesn’t taste the same. When we assume the growth will continue, we’re assuming a lot of things. In this case we assumed the pizza audience stay the same and maintain the same tastes, same ideas of health, and same desire to get pizza.

With investing, just like when buying a business – they’re the same thing really, we make a lot of assumptions. Whether we think the price will go up or the conditions leading to that businesses success will stay the same.

The reason I bring up growth and value investing first, is because these are the two most common types of investing.  You often see mutual funds, etfs, and even some index funds that have some sort of value or growth stock picking strategy. I say even index funds, because they are seen as following a basic index. Often times they will follow an index but a bit more capital on stocks they think are high value or high growth. Every mutual fund, index fund, and etf is different on how they do this.

The next disclaimer I want to make is that the line between value and growth is actually not so clear cut. Often pooled investments like the mutual funds, index funds, and etfs mix a blend of growth and value. And while many people consider Warren Buffett a value investor, he doesn’t. He consideres himself a value and growth investor and argues that they’re really not that different. His process uses both and he thinks they are interrelated.

A general theme you will notice among investors and traders is that they often blend different styles to create their own. This also often reflects personality and what appeals to them.  Think of it as sort of your political view. It’s not common to have a view that’s 100% the same as your political affiliation. There may be issues that you agree with different political groups on.

Let’s focus on some different trading styles

A common stereotype is that investors focus primarily on the fundamentals, or accounting, along with other market conditions, and traders focus on something called technical analysis. The truth is that many mix and match their styles. If you want to learn more about this, I strongly recommend you read Market Wizards, all four of them, and in particular the first two. It’s an interview style series of books that talks to the top traders of a few generations now. It’s an incredible way to learn how some of the top minds look at markets and the backgrounds. It’s very entertaining and easy to read. I highly recommend the book series to anybody trying to learn more.

But let’s discuss what technical analysis is.

Technical analysis is the idea of looking at price, volume, and other historical market data to predict the future. Well, that actually might be the technical definition, but I’m going to expand upon this and say while technically technical analysis tries to predict the future, we have to be careful the way we say predict.

Here’s why: when technical analysis do their work, they aim to be right half the time. Some of the best traders will have hit ratios, a ratio of the # number of winning trades to the # of losing trades,  of like 55%. That’s pretty much only half. So when they predict the future, it’s not with 100% certainty, it’s trying to be right more often than they’re wrong. This is actually true of all traders, not just those who use technical analysis.

And here’s another twist: sometimes traders don’t mind being right less than half the time. But how do they make money? Sometimes traders bet that even though they lose more times than they win, when they do win they win big enough to make up for the losses.

So what’s example of technical analysis? One of the most common is the idea of the “golden cross.” It requires doing a simple moving average, or SMA. That is for each day, you take the average of the past x number of days. For example an SMA 50, is a simple moving average of the past 50 days.  This captures the general price trends, it “smooths things out.” I put a screenshot on the blog of what this looks like, look for the podcast episode 6 blog post. So the golden cross is when the SMA 50 crosses above the SMA 200 you go long. In other words, when the short term trend, SMA 50, breaks the longer term trend, the SMA 200. There is a picture of this on the blog too. But the idea is that the shorter term trend crossing the longer term, means things are starting to look up and it’s time to buy. This strategy tends to work when things are trending, but works terribly if stock prices aren’t going up but moving in a range.

There are thousands of different technical analysis tools, but the question you may all be asking is, “Rishi, does technical analysis work.” I’m not going to back down from this question. This is a hot debate among many people and I will say this: yes, but not in a way many people use it.

The best people I’ve met who use technical analsyis, and keep in mind I am considering all historical market data when making this claim, do not use it in the way that many books teach it. They do not look at candlesticks and think, “this has to happen.” The best traders I know who use it, see it as a framework to look at the world. They use it to compare current events to previous. They understand that it doesn’t work all the time. And they understand that in certain market cycles it works, and in other market cycles it doesn’t work. For a ten year period the strategy may not work, but the next 10 years it may work wonderfully. They spend their time trying to understand why it works and when it works. They spend their time making sure it’s not just randomness.

Some technical analysis traders use computer programs to execute trades quickly. Some academic paper show it works, but not extremely well like you may think. If you’re scanning academic papers, look for things like momentum strategies. Often times they use more advanced concepts like portfolio construction to boost returns, this is a topic we will cover later.

What really upsets me is when I read books like “You can make millions by learning these patterns.” No, that’s a sure way to lose money. The best technical analysis people use very few indicators and don’t clutter their screen. They prefer simplicity not complex models. There is a good mathematical reason for this, why simple is better, that we’ll touch upon in a future episode.

If technical analysis was perfect, everybody would be doing it. It takes a lot of hard work, thousands of hours to get right, and even then success isn’t guaranteed.

There are many ways to make money and it’s not an easy problem to solve. Often times a lot of books and research market technical analysis to beginning investors and I can’t stand this. They make it seem like it’s a get rich quick scheme. They don’t include things like statistics, how many strategies don’t really work, and how it’s an extremely complicated problem.  As a new investor or trader, I can’t stress enough that you don’t trade real money with technical analysis. And a lot of marketing material promises riches for following a new technical analysis system. Any time you see a publication telling you this stock trading robot made a ton of money, always wonder why they wouldn’t keep it a secret? Why wuldn’t they just trade it for themselves. In markets, if a strategy that generates a lot money is made public, it stops making that kind of money. The reason?  Once people know what a strategy is, they put the bets on before anybody else.

Think of it this way, if you knew this stock robot made a ton of money and what it was going to buy, wouldn’t you buy it first? And if everybody bought it, the price would go up too much, and so you would have others selling it. It’s a complex topic we’ll touch upon in a coming episode about market theory, but when a money generating algorithm is creating, you keep it a secret. As soon as other people in the market figure it out, they will place the trades ahead of you and if you were planning to buy the stock at $80 and sell at $90, because other people bought it before you, it’s now at $90 and your trade makes no money.  In fact, some people will start purposely selling it at $80 because they know there will be buyers, and as soon as the price doesn’t go up, the buyer realizes the strategy isn’t working, then sells it. Now you have a ton of sellers.  And now the people who were originally selling? They are now buying again because the price has come down a ton. This is how secret strategies break. So if somebody is promising you an amazing technical analysis strategy, know that there’s almost a 100% guarantee it’s a sham.

Before I conclude this section on trading, I want to discuss two types of trading you hear about: discretionary and quantitative, and the stuff in between

One type of trader you hear about is the discretionary trader. At the extreme end of the spectrum, they are traders who trade on gut feeling, but there is much more to that. The successful ones have been watching markets for many many years and constantly pour themselves into research and sometimes technical analysis studies. They read history books understanding what happened at different points in time and are constantly keeping up with the news. While they do follow risk management and don’t take positions that are too big, they don’t automate this process. They believe their mind allows them to quickly adapt and understand when markets change. This is their edge.

Quantitative traders at the extreme end are those who completely automate their process. They research markets, constantly test strategies…some strategies may be technical analysis based, others may be news reading algorithms that take positions before anybody else can, and when they get a signal to buy or sell, an algorithm takes care of it. Quantitative traders can be highly quantitative in that they look at markets in statistics or a programming problem, while others believe they can use market events and economic trends to create a system.

Most traders often are a blend of the two that fall somewhere on the spectrum. Some may have algorithms but sometimes exercise discretion on them. For example if an algorithm is telling them to buy, they may realize the algorithm doesn’t take into account information it hasn’t seen before, so they will decide not to do it.  After speaking with many people, some traders argue that the best traders are those who take into account both quantitative and discretion. My opinion?

It doesn’t matter. The best trading or investing style will be what works for you and what fits your personality. It will take many years and thousands upon thousands of hours worth of work. People often think of wall st or investing and trading as glamorous jobs…but in reality the top traders I’ve worked with constantly pour themselves into their work. They do it because they love their job, not necessarily for the money or lifestyle. In fact, the top traders I know you would walk right by on the street and never know. For them this is what they love and they spend much of their free time doing it.

Actually, you know what – I’m going to conclude this episode now by telling you the secret of the greatest traders and investors I know. I’ll say it multiple times throughout this series, but I need to declare this right now because trading and investing can often be an art and takes work. So here’s the key before we continue: the best traders and investors are those who view their style as a process. A process they are constantly improving and making better. They know eventually the outcome will follow, but at each step they are studying their mistakes and winners. They realize that their outcome is a mixture of skill and luck. They can’t control the luck, but given enough time, the skill will win out. They keep journals of their winners, losers, and what’s going on in markets. They are generally nice people, humbled many times by getting their butt kicked in markets. Yes, you hear of the ones who are jerks, but jerks who are successful aren’t as common as it appears. Many have a philosophy behind doing what they do.

So becoming a good investor and trader is a lot of hard work. You hear of the people who start immediately and get rich, but many of them are lucky and do not last long. It takes a lot of grit and hard work, which is in my opinon why you often see traders who are very humble. Unfortunately, the ones who are not so humble often make themselves shown on TV.

Oh man, this kinda feels a little motivating. Don’t be intimidated by the hard work. In fact, embrace it. Because if you embrace it you have a two options 1) you can decide to put in the effort to constantly get better or 2) you can decide it’s not worth it for you and you rather be more passive or laid back about your investments. Both are good options and it depends upon your personality.

If you decide even on #2, this podcast will continue to be helpful for you because the types of stuff I’llb e discussing are for those who want to trade or invest actively, and those who want to do so passively. Many of the same tactics to improve portfolios work on both types of traders. They’re some really cool concepts we’re going to discuss and I’m excited. Knowing about the different types of investing styles really opened my mind to markets.

A lot of people don’t typically see financial markets as a creative space, but it really is. I mean, you have to not only be creative to come up with cool ideas many people haven’t though of, but also you have to have courage and discipline. A lot of traders and investors find ways to generate ideas. They love it. You could be walking through the streets of a city or a mall and suddenly see a new store or restaurant. You may eat the food and love it, and now you want to know if it’s a good investment. Maybe it’s only the 12th store open but the company trades ona s tock exchange.  Once you start investing and trading, you see the world filled with opportunities and your brain will constantly be coming up with new ideas.

My goal in this series is to help you get your ideas into your portfolio in the best most possible way. Maybe your ideas lead to index funds of stocks and bonds, but even in that space there is so so so much you can do to improve even the most passive of portfolios. I can’t tell you all how excited I am.

Okay all, hope you had as much fun listening to this episode as I had creating it. Please E-mail me with feedback at [email protected]. If you have any questions, E-mail me as well and I’ll do my best to get back to you. I sometimes send ridiculously long E-mail replies back to people, so I may start institution a 15min call to discuss with you an answer instead haha. Anyway, please support Tiingo so that I may continue doing this. The site to send a few bucks, even $2/month, is Tiingo.com/support. Thanks so much and will be back soon! I’m going to be working on an episode with Brett Harris about student loans. It will be good, so get ready.


Facebooktwitterredditpinterestlinkedinmail
Podcast: Ep.4 Portfolio Diversification (Beta and Correlation)

Podcast: Ep.4 Portfolio Diversification (Beta and Correlation)

This is the pilot episode of Tiingo Investing that explores what true portfolio diversification is, what metrics we can use to measure diversification, and how we can prevent misusing them. Understanding these concepts will help you create a more stable investment and retirement portfolio. This podcast later explores more advanced topics and is meant for the beginning investor to the professional.

This was a Pilot episode and was the first episode in the series. Tiingo started with Episode 4, Star Wars Style. The actual date of publication was March 1st, 2015 but is dated March 15, 2015 on the blog to keep chronology in tact.

With that! Here are the links.

If you have iTunes please use that as it helps my rankings within the store. Don’t forget to subscribe to stay updated on future episodes!

iTunes Link

Non-Itunes (tiingo.com)

You can find the script of this podcast at the bottom of the E-mail.

Here is the script that was used in today’s episode.

Note: I don’t follow scripts word-for-word as they can sound unnatural, but the episodes do closely follow them.

This is a partial script:

The Beta Correlation podcast

Welcome to the Tiingo Investing podcast. Where we teach you how to make a better investment and retirement portfolio. Our goal is to explain everything, from basic to advanced concepts in plain language you can understand – whether you are a beginning investor, or a professional

Welcome to the pilot episode of a podcast series I call “How to create the best investment and retirement portfolio.” I’m starting this podcast to my friends, family, and the general public who ask me frequently how to handle their portfolios. In this podcast, I explain complex topics in very simple plain language that anybody, from the everyday person to the professional, can understand


This episode of Tiingo investing, we are going to talk about diversifying your investments and introduce you to two under-used metrics that can really help us make both our investment portfolios and/or trading strategies better. Many of us have heard of price/earnings ratios or price/book ratios, but what about beta and correlation?  If you already know what these are, get ready because we are going to get funky and get you to think about these in a way you haven’t before. And if you don’t know them yet? Well we are going to explain it first and then get funky.


Not many people know this, but this topic hits home for me actually. When I first started on wall street, I traded stock correlation for a bit. Yes, turns out it’s possible to trade a statistic.


Almost all of you were taught to diversify your portfolios.  It’s almost investing 101. You tell a friend you’re about to start investing and they always tell you at least 1 of 3 things

  • stock tip

or

  • how much money they have made or lost
  • Diversify your portfolioi!


Many of you are thinking about diversifying your portfolio or feel like you already have. The key to creating a diverse portfolio is not having many  different funds, etfs, or stocks in your portfolio. The key to creating  diversification is understanding how all those pieces move together.  So if you are an investor, or even a short-term trader, correlation and beta are important because they are diversification.


Anyway,, beta and correlation help tells us about the risks involved in our portfolios. We are going to cover what they are, why they are important, how to use them, and the dangers of misusing them.


To start, let’s begin with a few quotes stressing how important correlation and beta were in our most recent financial crises. If these quotes don’t make sense to you now, they will by the end of our discussion.

Tiingo Investing

“Investors who increased allocations to international stocks, emerging markets, real estate, hedge funds, high-yield bonds, and natural resources during the previous decade did so at least partly because these investments’ correlations to U.S. stocks, and to each other, had been low in the past. Unfortunately, the correlations increased significantly in recent years. As a result, an expected reduction in risk did not occur, and in the 2008 bear market investors suffered much larger losses than expected.”

MacBride, Forbes

http://www.forbes.com/sites/riabiz/2011/03/09/understanding-the-recent-rise-in-correlations-and-how-you-can-turn-it-to-your-advantage/

“Equity market-neutral strategies tend to do well when stocks are not highly correlated to each other. Since 2008, stocks have shown increasing correlation, among and across sectors and geographies,
causing many equity market-neutral managers to struggle.”

http://advisor.morningstar.com/uploaded/pdf/alt_marketneutralmfcs.pdf

So what is correlation and beta and how are they different?

Correlation measures the strength of how two stocks or other data series move together.  Correlation can be a number between -1 and 1. -1 means the stocks are perfectly negatively correlated and 1, meaning perfectly correlated. 0 means no correlation.

Notice how I said correlation measures the strength of how the relationship moves, but not the actual relationship. In other words, correlation can’t tell you how much something moves relative to another, but whether, and in what direction, two things move together.

For example, if Apple moves 5% today and 10% tomorrow, and google moves 10% today and 20% tomorrow, they have a correlation of 1. Correlation is telling us they are strongly related in movement.

Let’s take another example

If Apple, again moved 5% today and 10% tomorrow, and google moved 15% today and 30% tomorrow, they still have a correlation of 1.

Correlation doesn’t tell us how much Google moves when Apple moves 5%, just that if Apple moves twice as much as it does from yesterday, so does Google.


So what can tell us how much something moves? This is where beta can come in 

Whereas correlation tells us the strength of how two stocks are related, beta tells us more about the relationship. Beta tells us both the direction the two stocks move in and by how much.

For example, in the above statement we said if Apple moved 5% today and 10% tomorrow, Google moved 10% today and 20% tomorrow. We can say that Google has a beta of 2 to Apple. So to figure out Google’s move, you take Apple’s move of 5% and times it by the beta, which is 2.  This gives 10% for Google.  In other words, Google moves twice as high as Apple does.

Now beta is more commonly reported metric on many websites. But usually it just says “beta.” Generally, when websites show beta they show how the asset moves to the S&P.

If you still don’t have a grasp of what these are, that’s okay.  You’re going to hear these descriptions throughout and by the end of it, I promise you will have understand the basics.

So why are these metrics so important?
http://arxiv.org/pdf/1102.1339.pdf


These metrics are important because they are diversification.  Let me explain,


As we mentioned at the beginning of the podcast, every investor has wanted to diversify their portfolio. But if we ask ourselves, what is the point of diversification? And the reason for that is uncertainty.


If we knew a stock like Coca a Cola would return 10% every year, no matter what, what would you do? The logical thing would be to take out as many loans as you could. sell your house, and put all your investments into Coke. There would be no point in needing diversification because you knew the return you would get every year.


But the reality is that we don’t know how much a stock or asset will give us each year – we live in a world of uncertainty, but we generally do know how things react. For example, usually, but not always, bonds will perform better than stocks in times of recessions.  At the same time, bonds still give us a return in the good times as well. Because of this, they tend not to be as correlated as stocks. In other words, they tend not to move in the same direction as stocks all of the time. In addition, bonds tend to have a lower beta than stocks. This means that they tend to give us lower returns than stocks in good times and higher returns than stocks in bad times. So we can see, bonds generally give us a lower reward but are also lower risk. This is what correlation and beta tell us.


So the key to creating a diverse portfolio is NOT having different stocks, bonds, etfs, commodities, etc. The key to creating a diverse portfolio is having different assets that are uncorrelated and also give you positive expected value. Hollld up, what does positive expected value mean? Positive Expected Value, or positive EV means you expect the asset, a stock or mutual fund in this case, to make you money. It’s the reason we invest in things, because we expect that they will give us money.


And many of you think professionals have mastered this technique, but if you look at any major financial crises, it has brought down banks and hedge funds, those who are supposed to be the most intelligent and well-versed investors. And actually, a lot of them understand correlation and do diversify their risk. The problem that many of us make though, including professionals, is that we underestimate how correlated assets can get in recessions and downturns. And actually sometimes it’s not intuitive.


Let’s take 2008 for example. We started this podcast with a quote describing how correlation among stocks increased rapidly. So if you were in a utility company, and S&P, they went from a low correlation in good times to an incredibly high one. And this is one of the most important things we need to understand about beta and correlation: they are constantly changing. And not only are they changing, they can change incredibly rapidly in a short amount of time.

If we want to take a look why, think about what us investors do in time of panic. We sell and we sell immediately. We don’t care what we’re selling, we just want to get out of stocks before others do so we don’t lose as much. Some of us may not sell, but many of us have seen what happens on either side.  So in times of panic correlation can go from .2 or 20% to 80% or higher.  Those 20 stocks you thought were diversified in the good times? well now they’re all moving in the same direction!


And not just stocks, but even stocks and bonds. During panic sell-offs, the correlation of stocks and bonds also become incredibly elevated.  For example, the S&P and long-term US treasuries, which many people argue are the safest bonds in the world, weekly correlation  went from a negative correlation of -30% to almost a positive 70% in a little over 2 months. In other words, we think bonds protect us in the bad times…which they did in 2006. But as soon as panic set in, they moved in the same direction as stocks!


And not only this, sometimes correlation moves can be unintuitive.  In 2011, correlation among stocks in the S&P went higher than they did in 2008. In August 2011, there was panic regarding the Eurozone and whether or not Greece or other countries would leave the Eurozone, but the panic only led to a much much smaller sell-off in the S&P and DOW than 2008. A 16% sell-off led to higher correlation among stocks in the S&P than did a sell-off greater than 50%. Nuts huh?


So what can we do about this? First we will quickly go over tools on how to calculate these values and then how to use them to protect our portfolios.


How do you calculate beta/correlation?

Let’s take a moment and discuss some tools e can use to calculate beta and correlation. And for the record,  we’re going to skip the mathematical explanations here and instead focus on what you need to calculate the statistics and how you can do it. I’m going to bring up Tiingo’s tools and tools other websites offer. I’m not trying to sell or push you anything – in fact Tiingo is free. The reason I am using Tiingo’s products is that I made these tools because I realized no other website or service let you do this. And the ones that already had them calculated? Well their calculations are wrong and they don’t show you the numbers you need!

Facebooktwitterredditpinterestlinkedinmail
Podcast: Ep.3 One Portfolio and Broker Please!

Podcast: Ep.3 One Portfolio and Broker Please!

Learn more than basic portfolio advice and take a much deeper dive. This episode explains how we can measure our portfolios (more than just returns), and why financial advisors give the advice they do. It discusses what volatility is, why it’s important, and how our portfolios should change as we change. Finally, we discuss important things to look for in choosing a broker that can help you save money and fulfill your goals.

With that! Here are the links.

If you have iTunes please use that as it helps my rankings within the store. Don’t forget to subscribe to stay updated on future episodes!

iTunes Link

Non-Itunes (tiingo.com)

You can find the script of this podcast at the bottom of the E-mail.

Here is the script that was used in today’s episode.

Note: I don’t follow scripts word-for-word as they can sound unnatural, but the episodes do closely follow them.

Episode 3 – Yes, I’ll have one portfolio and broker please

This is episode 3 and today we’re going to use everything we learned to create a basic portfolio. Before I begin, I just want to say a big thank you to the amazing reception this podcast has received. It’s gotten 33 5 star ratings in two weeks and over 800 downloads across the world. The feedback I’ve received has been incredible and I look forward to continuing this series. We are now an international podcast.

Let’s move on to the topic!

Since we’re about to get a little bit edgy, I want to state here that I am not giving financial advice. I want this podcast to empower people with the knowledge and tools so they know what they want and can create it! I don’t know the financial situation of my listeners so it’s important to me that your knowledge will be flexible enough that you know what you want to do.  I want to empower people will the freedom of not having to rely on others for financial advice, but knowing they can rely on themselves. And if you, the listener, do choose to rely on financial advice – it will be because of convenience and you will be able to understand your advisor. You will be able to follow along with them, ask them questions, challenge them, and make sure you’re getting what you’re spending your hard earned money on.

Let’s continue on. For this episode, we will first discuss what is a portfolio, what are common principles we should keep in mind when designing a portfolio, the different types of investments that exist when designing one, and in the end we will discuss how you can choose a broker and all the things to keep in mind when choosing one.

To begin, let’s talk about what a portfolio is. A portfolio simply means a group of investments that we hold. It could be just one investment to thousands. In this episode we’re going to talk mostly about pooled investments, specifically index funds.  The general consensus is that a portfolio of different kinds of index funds is the best thing to do as a beginner. It’s easy, less work, low fees, and studies support it’s the best way for new investors to get the highest overall return.

Now that we’ve defined a portfolio, we have to figure out some way to measure what’s good or not. After all, what good is having a portfolio if it loses us money.  In previous episodes we discussed how a return on an investment is a way to measure if it’s good.  A return is simply saying, how much  money do I make for every dollar I put in? We measure our portfolios the same way. If I said  got 6% this year. So if I had $100,000, I made $6000.  My portfolio is now $106,000. But there’s a twist to it.

Let’s say we had $100,000 on January 1st 2015. On December 31st, 2015 we had $106,000. So overall we made 6%. But what if the market took a terrible turn and in the first 6 months of the year, we lost 30%…so on June 1st 2015 our $100,000 investment was now at $70,000. How would this make you feel? This really wouldn’t make me feel so good.  Then let’s say the market quickly rebounded and recovered and you ended up making $36,000 in the next six months. So overall, you came out 6% higher.

Now let’s take another scenario. Let’s say we still ended up with $106,000 by the end of the year. But when June came around, this time markets were much more tame and we made 3%. So we made $3,000 and our portfolio was $103,000 by mid-year. This time markets continued to remain team and we made another $3,000 so we ended up the year with $106,000 – or 6%.


Now which of those sounds more appealing? We both ended up with the same amount of money, but in the first case markets were a massive rollercoaster. The reason most of us prefer #2, unless you got some sort of adrenaline problem going on, is because less of something we call volatility. The second case has volatility. Volatility in very simple terms, means how much something moves around.  In our portfolio example, the first portfolio had a lot of volatility, it’s value changed considerably in a short amount of time. In the second case, our portfolio was growing slow and steady, so it didn’t have as many wild swings. It is said to have less volatility.

So volatility is actually a super complex topic many mathematicians, financial professionals, traders, and academics spend so much time on. Because of this, We’ll probably dedicate an entire episode to in the future.

But the core of what I am saying is, that returns are not the only thing we care about. We also care about the volatility of those returns. We want something that gives us the most amount of return for the least amount of volatility. People often say volatility is a measure of risk. The riskiness of our portfolio is determined by the volatility.

Why is that? There are a couple reasons.  First let me mention, volatility has no direction.  It can go up just as fast as it can come down. Actually, in practice you’ll se in markets, that markets crash much much quicker than they go up. If you pull up a chart of the S&P, you can use the ETF called SPY. You will see gradual moves up, the quick sudden violent crashes.

Let’s say we started with $100,000 again. And this time let’s say we are in a high volatility portfolio. Our portfolio at first does very well and doubles. It has a 100% return. We now have $200,000. Now let’s say, because it has such a high volatility, it goes down 80%. What is our portfolio worth now?  It is now worth $40,000. Now let’s say it goes up 100%- so it doubles. It is now worth $80k. You see, even though the price doubled twice, because it fell by 80%, it never fully recovered. It doubled, lost 80%, then doubled again. This is what volatility does.  But what if the portfolio fell 80%, but instead of  going up 100% for a second time. So it doubled, went down 80% then another 80%.  That $40k you had left would now be worth $8k.

So when we hear about somebody making a lot of money, we have to ask, “well how volatile was your portfolio?” Because if they doubled their money in 2 weeks, it could go down more rapidly in the following 2 weeks. The goal of this podcast is to create a portfolio that maximizes our return and tries to minimize volatility.

So let’s move on to discuss a standard portfolio that people use to try and achieve this:


Stocks and bonds

I want to begin this by going over a couple starter portfolios. Often if you google what you should do to start investing, you get all sorts of answers and long answers. You read and read read and it’s frustrating because nobody gives you a straight answer. Then you come across an article that gives you a very straight answer but doesn’t get into the nitty gritty. And this is where I want this podcast to be helpful for you. We’re going to work backwards – we will discuss why people give you these quote, “rules of thumb” and then get into the nitty gritty. Cool?

Awesome! Let’s talk stocks. Typically, stocks return between 9-10% on average a year. Government bonds return between 5-6% a year. The standard blanket financial advice is, you should be in 60% stocks and 40% bonds. Now why is that? We discussed in episode 1 how AAA bonds, are typically seen as safer. AAA is a credit rating of a country or company, it is the highest rating. Think of it like a credit score for the country or company. AAA is the highest credit score a country or company can have. Because bonds tend to be safer, they return 5-6% on average. The volatility of stocks tends to be higher than bonds though.  So notice how the returns of stocks are higher than bonds but the volatility is higher. People typically say stocks are riskier, but the market gives you more if you want to take that risk.

That’s a general guideline of markets:  If you are taking more risk, you should be paid more. If you are taking less risk, you should be paid less. If you are taking more risk and not being paid more, that’s not a good thing.

So because of these reasons, a balance between  stocks and bonds is often recommended. Stocks and bonds do not typically move together, but they both return you money. This is a concept called positive expected value. We invest in stocks, bonds, and other things because we expect them to make us money. They have a positive expected value.  But if two things don’t move together, that’s diversification. They both will make us money in the long run, but they may take different routes to get there. When one goes up the other may go down or stay the same. This helps stablizies things. For example if stocks drop 4% and bonds go up 2%, our portfolio is better off than if we were all in stocks.

Over time though, they both are expected to make us money, just taking different paths to get there. We will talk more in depth about how to measure how they move together in Episode 4 of our series.

Bringing it back, what about the 60/40 portfolio recommendation where we are 60% in stocks and 40% in bonds. How does it do? First let’s establish something to compare it to. Let’s see how a purely stock portfolio would do.

If we invested 100% of our portfolio in the S&P in 2005 and left it alone, That’s ten years prior to today, what would happen? Well today, our portfolio would be up 73%.  It would be worth $173,000. What would happen in the 2008 financial crises though? Well stocks fell 45% at one point, so if we invested $100,000, in 2008 we would’ve had $55,000 at one point. In 2015, we would have $173,000. That a heckuva rollercoaster!

What about our 60/40 portfolio? Well if we started it in 2005 and left it alone, it would be up 60% today. So $100,000 would be worth $160,000. What about 2008? It went down approximately 25%, so, it would have been $75,000 at one point. Compare that to a portfolio that was fully invested in stocks. Our lowest point would be $75,000 versus $55,000 for stocks. At the same time, we would end up $17k short compared to our all-stock portfolio. This is an example of the risk-reward tradeoff.

I’m going to ask you all to picture something, some of you did not have to witness. Imagine your portfolio was entirely stocks. Your entire retirement portfolio. Now imagine it is 2008 and you are going to retire next year. You are 64 years old and planning to live off your retirement. But now a financial crises happens, and you lost almost half of your entire retirement portfolio. How would you feel?

Unfortunately this happened to a lot of people. It was a devastating event for many people nearing retirement. Not only that, jobs were harder to come by as the retirement rate skyrocketed.

And this is a big issue with the 60/40 model. It doesn’t change as you change. As you approach retirement, you probably want to be in something more stable and you’re willing to take less of a return because of it. You don’t want to be close to retirement and potentially lose a lot of money.

SO that brings me to the next rule of thumb:

“100 minus your age” This means, you take 100, subtract your age, let’s pretend you’re 30, so 100 minus 30 gives us 70. That 70 represents the amount of your portfolio that should be invested in stocks. So if you are 50, that’s 100 minus 50, and you should be 50% in stocks. The other portion is typically bonds. So if you’re 30, 70% stocks, 30% bonds. If you’re 50, the 50% stocks and 50% bonds. 100 minus your age

Keep in mind, this isn’t financial advice from me, I will try my best not to give advice, but this is the commonly held advice that advisors share. The reason this is preferred to the 60/40, is that the portfolio changes are your situation changes.

As you get older, you may want to take less risk.

Now you may feel comfortable changing up this allocation tp whatever combination fo stocks and bonds that you like, but the reason I like this rule of thumb better, is that it encourages us to think dynamically. It gets us to question “how much risk can I take?” as we get older, change jobs, maybe you have kids, grandkids,  want to start a business, anything!

And I think one of the best measures I ever heard for assessing whether you’re comfortable with the risk or volatility you’re taking is this, “Are able to sleep at night?” If you’re going to bed worried and the like, your portfolio is probably too volatile.

I told you some statistics behind the 60/40 allocation, but I don’t know you’re age so how do you know how much you would make or lose in 2008 using the “100 minus age” formula? Well  I created a tool at Tiingo.com so you can run the same statistics I did! You can take your current portfolio, or a theoretical portfolio – what you want to invest in, and see how it would perform if 2008, 2001, or any time period repeated itself. This in finance is called a backtest. So to use it, go to Tiingo.com , two iis, and then click portfolio at the top. From there type in the stocks or etfs that you own  and the number of shares. Once you do that go to the top right corner where it says overview, and select backtest. The rest is self explanatory! I created some time periods for easy use just to make things easier.  This is a tool many hedge funds may $20k/month for more and I want to make it free for you all


Okay so we’ve discussed two different start portfolios: a 60/40 allocation a “100 minus your age” allocation. So maybe you now have an idea in your head of what kind of mix of stocks and bonds  you want. What do you actually trade to get them?

Going from our previous episode on pooled investments, a lot of research and advice tells us, as newbie investors we should stick to index funds or ETFs. The reason is that it takes a lot of time, effort, and research to select a mutual fund that may outperform. There are many kinds of ETFs out there for stocks, you will see small cap, which means smaller sized companies, to large cap. The S&P 500 is considered large cap.

So sticking with a basic stock index ETF you could use SPY or VOO. Throughout this podcast you’ve heard me say SPY, and one of the main reasons is that it’s sort of an industry standard. It also is the most widely traded S&P ETF. But if you’re looking at lowest fees, the Vanguard product VOO can’t be beat. It has a management fee of .05%.

For bonds, there are many different kinds of ETFs.  A common one used in the industry is TLT, the Barclays 20+ year government bond fund. This only invests in U.S. government bonds, considered very safe. Like SPY, you may hearme say TLT as it’s sort of an industry standard. But you can use something similar made by Vanguard, and that ticker is VGLT. It has a lower expense ratio than TLT. And I promise you, I’m not being promoted by Vanguard. In fact, I told them about this podcast hoping for a retweet and they pretty much said “cool bro.” in more corporate terms. The reason is that Vanguard tends to be the industry leader in reducing fees.

Of course there are many different kinds of stock and bond funds. Things like growth stock funds to value stock funds. Same with Bond ETFs. We will get into those topics later down the line.

But for right now with two ETFs, VOO and VGLT, you can have a basic portfolio.  You got your stocks represented by the VOO ETF and you got your bonds represented by the VGLT ETF

Ok let’s go buy us some ETF!!! Oh wait…we need a broker.

So to choose a brok – wait let’s stop for a moment and appreciate how good that transition was….k im over it. You probably aren’t though, so ill pause one more second…


OK cool! So now we need a broker to wrap this all up. A broker is a company that helps us execute trades to buy and sell stocks, mutual funds, index funds, ETFs, and so on. How do we choose a broker? I’m not going to recommend a broker, because that’s not my style and frankly – I cant. Each and every one of you has unique circumstances so one broker may be better for you than another. I want to help you  find which broker suits your specific needs.

If you are listening to this episode, chances are you are going to be looking for a discount broker or opening a brokerage account with a mutual fund company. There are two main types of brokerages, a discount broker and a full-service broker. Full service brokers typically provide all sorts of services like advising, tax planning, etc. They are also much more costly.

The websites you typically hear about like TD Ameritrade, Scottrade, Tradeking, and so on are called discount brokers.  The way these brokers work is they charge you a fee each time you buy or sell a stock, mutual fund, index fund, ETF, and so on. So you get charged both on buying and selling. Typically these fees range from $5 to $10 for stocks and $10-$50 for mutual funds.  Here is where things can get tricky: a lot of these brokerages have partnerships or offers where they will give you discounts on specific ETFs, mutual funds, or index funds.  So you may not end up paying any commission on certain products!

You can also choose to invest directly with a mutual fund company by creating an account at Vanguard, Fidelity, and the like. The benefit to these is that they typically don’t charge any commission or fees on products they offer. This is nice if you know you’re going to stick to a specific company’s products. The downside is that if you do want to buy stocks or use another firm’s ETFs or mutual funds, it can be cost you another $10-$20.

So these transaction fees can be pretty significant, especially if you’re just starting to invest. Let’s say you had $1,000 to invest. Let’s say you went to broker RoadRunner Brokerage Company (I’m making this up),  and they charged you $5 every time you bought or sold an ETF. Well that’s $10 total, which is 1% of your $1000. So with $5 commissions each way, you’re going to be in the hole 1%! Let’s see we went to Coyote Brokerage Company and they charged $10 to buy and sell. That’s $20 total which is 2% of your $1,000 initial investment! These fees can add up a lot, especially if you think you will be trading frequently. So generally, you want to evaluate how much you will be trading, which products you will be trading, and make an estimate of the fees you will be paying at each broker.

There are also a few other fees you should be wary of and decide if it makes sense for you. Some brokerages charge inactivity fees, so if you don’t make any trades, they apply a fee.

The next thing I want to quickly discuss, is that if you go for a brokerage that isn’t popular, make sure they are SIPC insured. SIPC stands for Securities Investor Protection Corporation. When you deposit money in a bank, it is insured by a federal agency known as FDIC up to $250,000. The SIPC works similarly except for two major differences. It is NOT a federal agency but is federally mandated. The second is, that the SIPC will not protect you if you lose money by trading. It will protect you though if your brokerage goes bankrupt up to $500,000 and up to $250,000 can be in cash. It will not protect you if your broker misleads you with poor financial advice that loses you money.

Finally, in addition to the SIPC, each broker may get additional insurance to protect you for more than $500,000. If you fall into that category, take the time to call each broker and ask if they do. The websites can sometimes feel very confusing and almost like there are fees everywhere. Also take the time to google the broker and see if people have complaints about them.

Before we conclude our bit on brokerages, I want to pre-emptively address a question you may have. The sign up process for a broker is relatively straightforward, but many people pause at the question of “margin.” What is margin? Margin means you can borrow money from your broker, and then use that money to trade. You can basically take the cash in your account, double it, and use twice the money to trade. I HIGHLY HIGHLY DO NOT RECOMMEND THIS IF YOU ARE A NEW INVESTOR. IF YOU THINK YOU WILL BE TEMPTED, THAN YOU PROBABLY SHOULDN’T. The upside to a margin account is that when you sell out of a stock, ETF, or Mutual fund, it will take 3 days for the money to hit your account so you can trade again. This is abbreviated T+3. Today + 3 days. So if I sell out of a stock on Monday, I can ‘t trade with the proceeds of that sale until Thursday.

This is because there is clearing work that needs to happen, so you will not have access to the money until it happens. If you have margin, a broker will typically let you trade with that money as soon you sell out of the stock. So instead of having to wait T+three days for the money, if you have a margin account you can sell out of your stock, ten buy another with the money same day. SO if you sell out of your stockon Monday, you can buy more on Monday

Once you get your broker set up, you can transfer money and begin trading!

Wow we covered a lot in this episode. To recap, we talked about…A LOT. Haha. We’ve made amazing progress all. In just three episodes we now have a better understanding of what’s a portfolio, how we use returns in the context of volatility, two different types of portfolio allocations and their drawbacks and benefits, and how to choose a broker.


If investing in a company was like setting up a piece of equipment, we just did the “Quick start guide” Get ready friends because we’re about to read the entire manual…except the non-english translations. That might get redundant and I don’t want you confused as to why I suddenly started speaking fluent French. Actually, I don’t know how to speak French so I would be confused also.

So in the next episode we’re going to talk about correlation and beta. These are two metrics we can use to measure diversification. Understanding these will help us trade more than just large stocks and US bonds. We’re going to be breaking into more types of investments once we get these concepts down! The stocks, mutual fund, index fund, and ETF world is massive, and these metrics will help us narrow down the assets we care about!

Alright all! We’re awesome, you’re awesome and I loved making this episode. If you have any questions for me or feedback, please E-mail me at [email protected] I love hearing feedback, whether it’s good or bad.  I mean, everybody always likes compliments so you can always drop 1 or 2 in there too.


Facebooktwitterredditpinterestlinkedinmail
Podcast: Ep.2 The Amped Up Basics Pt. 2 (Mutual Funds, Index Funds, and ETFs)

Podcast: Ep.2 The Amped Up Basics Pt. 2 (Mutual Funds, Index Funds, and ETFs)

This episode describes mutual funds, index funds, and ETFs. It then takes it further by describing the background behind each one and how to tell if they are worth your money. The episode then describes fee structures and how certain fees may be deceptive. The podcast concludes with cost analysis and tells you which ones may save you the most amount of money and increase the returns of your portfolio. This is a perfect starter episode to somebody who wants to get their feet wet with investing, or wants to get a deeper understanding of the basics.

With that! Here are the links.

If you have iTunes please use that as it helps my rankings within the store. Don’t forget to subscribe to stay updated on future episodes!

iTunes Link

Non-Itunes (tiingo.com)

You can find the script of this podcast at the bottom of the E-mail.

Here is the script that was used in today’s episode.

Note: I don’t follow scripts word-for-word as they can sound unnatural, but the episodes do closely follow them.

The basics amped up – More than just stocks, bonds, mutual Funds, ETFs, index funds, and what we can expect


This is episode 2 in the series of how to create a better investment and retire,emt portfolio.  In this episode, we’re going to talk the basics of mutual funds, index funds, and ETFs then amp them up. We’re going to talk about not only what they are, but also what we can expect from them and how they work. If you don’t know what any of them are, that’s fine because we’re going to go through with them one-by-one.

Let’s jump right into it:

Most of us have heard of mutual funds, index funds, and ETFs, especially from financial advisors or articles we read. When we tell a friend we’re going to start investing or trading, they tell us tons of stock tips. But very rarely do they tell us their “favorite mutual fund.” It’s just not as sexy to say “OMGosh you gotta invest in the Fidelity Low Price Stock Fund It’s soooooo good. ”

But they can be sexy and we’ll get into that now.

So in the past episode we mentioned stocks and bonds. Well a mutual fund, index fund, and ETF is when we decide to give our money to another company and they buy stocks and/or bonds for us. Many other people do this too, so we as a group of individuals, we pool money together and give it to a company. This is the core essence of what Mutual funds, index funds, and ETFs all have in common.  We, as individuals, pool our money together, and give it a company so they can buy stocks and bonds on our behalf.

Investing together with other people has advantages for example, remember how I said bonds require a lot of money to buy or sell? Well individually we may not have enough money, but when we pool it together with others, suddenly we can own a ton of bonds – or an entire portfolio of just bonds.

The question you may be wondering is, well then what makes a mutual fund, index fund, and ETF different from each other? And the answer is, what makes them different, is what they decide to do with our money once we give it to them

Let’s discuss what a mutual fund does after we give them our money:

The company we give money too then hires people called “Portfolio Managers” who decide what to buy and sell for us. This allows us to make a more laid back approach to investing.

A benefit should be that since we all pool our money together, we can pay to hire somebody who is very very talented. In this case the company we give money to evaluates Portfolio Managers and hires them. Notice how I said this should be the case, that the portfolio managers we hire should be very talented… many people consider this line of thinking very optimistic and a lot of data agrees with them. But we’ll get to that in a few moments.

Because nothing is free, the Mutual fund company asks for a fee for managing our money and providing this service. The fee structure for mutual funds can be a bit complicated here so let’s break it down:

When you’re looking up a mutual fund, you may see a page related to expenses. A good site for this is Morningstar.com. You will see something called an expense ratio or net expense ratio. This is the total all inclusive fee that the management company takes out of your investment. Now when they take out this money, they don’t charge you directly. Instead, they collect the fee divided up for every day of year on daily basis. For example if the fee is 1%, they approximately divide 1% by 365 and apply that throughout the year.

So that is the net expense ratio, but what is it made of? Well it includes the management fee – paying the portfolio managers, the administrative fee for running the business, and a marketing fee. You may be wondering why you’re paying for a company to market, and this depends on your view of the company. Yes it’s true, some mutual fund companies may try to take advantage, but in order for the company to exist and be able to provide you this service, they do have to market.

Before we move on to the next type of fee, let’s talk about the management fee that’s included in the expense ratio, because this is pretty important. So a mutual fund manager typically gets paid between .20% to 1% – more or less. On a small mutual fund, like $100 million, the manager can take home $1 million dollars in pay. On $500 million, it may be $5 million. You may think this is outrageous, but if the fund manager can return you 5% more than you could, and you give up 1% to pay him, isn’t it worth it as you come away 4% richer? Now a lot of people argue that the fund manager isn’t worth their fees, that they don’t make up for the 1% that they charge…which means that they actually perform worse, but we’ll come to that in  a moment.

Okay, so now I want to talk about sales fees. This is something that really bothers me because I’ve seen it happen to a number of friends. When somebody pushes mutual funds on you, or they are financial advisor and they are pushing only their own company’s products on you, chances are there may be a large fee involved. This is called a load. Funds that do not charge a sales fee are called no-load funds. Those that do are load funds. And the fee is called a load fee. There are  a few types of load fees. The front-load fee is charged at the onset of a fund. So if you buy a mutual fund, they take away something like 5% immediately from the money you invested. A mutual fund isn’t allowed to charge a front-load fee of greater than 8.5%.

A back-end load means you pay the fee when you exit the mutual fund. There is often a variation of this which means you pay the load fee throughout the 5 or 6 years.

Now some people argue that if you buy a no-load fee, the fee is still there but put in the expense ratio. In my experiences, the funds that charge load fees are the ones that are pushed by individuals belonging to a “financial advisor” companies. On top of this, the “load” fee tends to be absurdly high. Because often the “load” is designed to get you to pay more. This is a deceptive tactic I have seen in the industry and it really upsets me. You will notice on this show, I always try to give a balanced perspective and take a neutral stand in the current events I discuss here. But on this topic I will express my opinion loud and clear. I’There are thousands of very reputable funds that offer no-load funds. In fact, I would argue the most reputable and top mutual funds do not charge a load fee

OKAY! So let’s move on from this frustrating load fee topic before I have to practice soothing meditative breathing.

Actually *breathe*

Alright I’m back. So you’re probably thinking, “AHHH RISHI SO MANY FEES! What do they all mean??”

In essence the fees mean this: since you are giving your hard earned money, you better make sure it’s worth it! So with that, let’s talk about how we can make sure the investment was worth it.


Okay, so far we have discussed what a mutual fund is, how they work, and what their fees are. And now let’s talk about how we can measure if they are useful. Afterall, since we’re paying fees we need to make sure that we’re getting our moneys worth. But before we can talk about if we’re getting our money’s worth, we need to discuss index funds.

So what are Index Funds and why do we need to discuss them?

So let’s just do a recap, we pool our money together with other investors and give it to companies so they can buy stocks and bonds on our behalf.  This is what mutual funds, index funds, and ETFs have in common. And because these companies charge fees for this convenience, we want to make sure we’re getting what we paid for: and that’s stellar amazing performance. After all, if the manager is going to be paid millions of dollars, we want to walk away knowing we’re better off too.

And how do we measure that? How do we know we’re better off? Well if we buy a mutual fund that’s supposed to pick the best large companies, what is a fair way to measure the portfolio manager? We could say, well the fund we invested in made 10% this year, so they must be awesome! But wait, what if the S&P 500, a stock index that tracks big companies, was up 30%? So the stock market was up 30%, but we are up 10%? That doesn’t feel so good does it?

And so the way we track the performance of mutual funds, is by comparing them to a stock index. So if we invest in a mutual fund that says “I will only invest in large companies and I’m going to be awesome at it” we compare the mutual fund’s performance to an index measuring big companies…which would be the S&P 500. If we invest in a mutual fund that says “I will be the best stock picker of smaller companies” we may compare them to the Russell 2000, a stock index that represents small and medium sized companies.

Now what if I told you, study after study after study, has shown that mutual fund managers perform worse than the stock index. Studies show that anywhere from 70-90% of mutual fund managers perform WORSE than the stock index once you take into account their fees.


And so you may be thinking, “well Rishi, I bet if we find one mutual fund manager who does really well, they will continue to do well.” Well other studies show that if you took 3,000 mutual funds, and invested in the top 25% of them….only 2 or 3 would stay in the top 25%.

This is why mutual funds get so much flak. As we discussed, it’s okay if a mutual fund collects high fees, as long as you’re better off more than you could be without the fund. But studies show this is very much not the case.

Now the truth is, there are some stellar stellar mutual funds out there. There are some people who are so brilliant and put so much work into it, that their process is very good. The issue isn’t that they don’t exist, the issue is that they are very hard to predict and find. There are people out there whose sole job is to find the top mutual funds and invest in them. And then there are others who invest in a very concentrated portfolio of stocks. Instead of holding 100-200 stocks, they may hold 20-30.  The argument that people make against mutual funds isn’t that there aren’t any good ones out there…the argument is that they are incredibly hard to find and it may not be worth your time. The vast majority of the time you’re better off holding the stock index.

Even Warren Buffett, whom many consider the best stock and company picker of all time, has said to put your money in index funds.

Here is a quote from one of his letters:

My advice to the trustee couldn’t be more simple: Put 10% of the cash in short-term government bonds and 90% in a very low-cost S&P 500 index fund. (I suggest Vanguard’s.) I believe the trust’s long-term results from this policy will be superior to those attained by most investors — whether pension funds, institutions or individuals — who employ high-fee managers.

Before I want to continue, I want to urge individuals not to immediately put 90% of their money in stocks. We will discuss why in the next episode. There are specific reasons Warren Buffett advocates this, which if you follow his advice without knowing the context of it, can be very dangerous.

Okay, now that we’ve set the stage for index funds, let’s talk about what they are:

Throughout all of this you may have thought, well it’s all good and well to compare a mutual fund manager to an index…but what difference does it make? A stock index is just a statistical measurement. We can’t invest in a statistical measurement.

Well turns out this is where index funds came into play! Let’s start with the story: John Bogle was one of the first individuals to study mutual funds and realized they were no better than index funds. In 1974 Bogle started the Vanguard group and in 1975 formed the first index fund. An index fund works by buying the stocks that make up an index in their right proportions. For example, an S&P 500 index fund would buy all 500 stocks in equal proportion.  They may use other instruments too, but that’s a more advanced topic for later. Just know, an index fund tracks the index, like the S&P, very very closely by replicating the index. Anyway, back to our story about Bogle.  People thought he was crazy and was nuts for creating a product that would returne “just average returns.” Well Bogle turned out to be one of the smartest individuals out there. A pretty good motivational story given that Warren Buffett in the above quote recommended Vanguard and The Vanguard Group now manages $3 trillion dollars.

So what makes an index fund and index fund, besides it tracks the performance of a stock index?

An index fund should have no load, or no sales fee. On top of that is expense ratio is very very low. For example, according to vanguard the industry average expense ratio is around 1.1%. The average index fund offered by Vanguard has an expense ratio of 0.2%. The reason index funds are so much cheaper is that their management fee is much much smaller. They may also eliminate marketing fees and keep their administrative fees very very low. By not having to pay for quote “very talented managers” and searching for them, they stick to the index. By going to an index fund, you save an extra .90% on average. Over time that can add up to quite a bit.
Just to put things into perspective. If you invested 10,000 into a mutual fund with a fee of 1.10% and also another $10,000 in an index fund with an expense ratio of .20%…after 10 years you would save $1,500 with the index fund. That’s a 15% savings on your initial $10,000.

This is why people advocate index funds so much.

So far we’ve discussed mutual funds, index funds, and compared their performance. Now let’s talk about ETFs.

ETFs are an abbreviation for an Exchange-traded-fund

You can think of an ETF between a hybrid of a mutual fund, index fund, and stock all in one. Before we get into the ETF structure, let’s talk about buying a mutual fund or index fund. Let’s say you’ve now figured out which mutual fund or index fund you’re going to buy. When you place an order, it is executed the same day or the next, but it is not executed immediately. When you buy or sell a stock, you see the price on the screen and as soon as you buy or sell the stock you get that price or very close to it immediately. This is not the case with a mutual fund or index fund. With a mutual fund or index fund, you don’t know what price you get until the end of the day or the next day. This is because the value, or Net Asset Value, abbreviated NAV, is calculated at the end of the day. The cash value of stocks being held to replicate an S&P 500 index fund is called the Net Asset Value. Remember, an S&P 500 index fund buys the underlying stocks to replicate it (sort of). And those stocks are worth something – the NAV.


This sounds so complicated! Wouldn’t it be awesome if buying a mutual fund or index fund was like buying a stock? Well that’s where ETFs come in. An ETF is a vehicle that mixes a stock structure with the concept of a mutual fund or index fund. SO you are pooling your money together with other investors when you buy an ETF, but the ETF trades on an exchange like a stock. I know this is a bit weird, but think of it this way: instead of getting a price at the end of the day, like when you buy a mutual fund or index fund, the price of the ETF is continually changing throughout the day – just like a stock.


Now here is the thing with ETF index funds. Their fees are cheap. Very cheap. Not only are there many thousands of different ETFs out there, allowing you to easily diversify, they are also very easy to trade. It’s like trading a stock. AND on top of that, they are so much cheaper. Take for example Vanguard. And no I’m not being paid by them, it’s just they are the pioneers and one of the most popular.
The Vanguard S&P 500 index fund has an expense ratio of 0.17%. What about the equivalent ETF? 0.05%.  Now here’s the thing with Vanguard and it will illustrate a point. If you have $10,000 to invest, you can qualify for their lower fee index fund, which charges .05%, the same as their ETF. In this case it make sense to go with the index fund instead of the ETF. The reason is, is that ETFs trade like stocks, and when you trade stocks, you have to pay a commission. Now a broke rmay charge you a commission on a mutual fund too. So sometimes things can get dicey, but often it is cheaper, from an expense ratio standpoint to hold an ETF than an index fund.

Wow we’ve covered a lot of the basics here on the amped up basics. We’ve focused mainly on large company mutual funds, index funds, and etfs. The truth is that there are many many different categories of mutual funds, index funds, and etfs. For example, there are some funds that only focus on the U.S. market while others that only focus on the international market, including specific countries. But we will get into that in the next episode when we discuss how to put this all together in a basic investment or retirement portfolio. Not bad for learning all of this in little over an hour!


I hope you all have enjoyed listening to the amped up basics just as much as I have had creating it.

If you have any feedback please E-mail me at [email protected]. In the next episode, we’re going to talk about commodities, mutual funds, index funds, etcs and so on.


Facebooktwitterredditpinterestlinkedinmail
Podcast: Ep.1 The Amped Up Basics Pt. 1 (Stocks, Bonds, and Commodities)

Podcast: Ep.1 The Amped Up Basics Pt. 1 (Stocks, Bonds, and Commodities)

This episode describes stocks, bonds, and commodities and then amps it up. It not only covers them, but also discusses stock indices, exchanges, how these assets are traded, and what kind of risk they typically present. The episode then covers deeper topics like how to value a company, how the stock indices measure different things, and what can happen when a country defaults. It even discusses the deficiencies in certain stock indices, like the DOW. This is a perfect starter episode to somebody who wants to get their feet wet with investing, or wants to get a deeper understanding of the basics.

With that! Here are the links.

If you have iTunes please use that as it helps my rankings within the store. Don’t forget to subscribe to stay updated on future episodes!

iTunes Link

http://tiingo.com/podcasts

You can find the script of this podcast at the bottom of the E-mail.

Here is the script that was used in today’s episode.

Note: I don’t follow scripts word-for-word as they can sound unnatural, but the episodes do closely follow them.

The basics amped up – More than just stocks, bonds, mutual Funds, ETFs, index funds, and what we can expect


This is episode 1 in the series of how to create a better investment and retirement portfolio.  In this episode, we’re going to take the basics of stocks, bonds, etc and amp them up. We’re going to talk about what stocks, bonds, commodities, mutual funds, index funds, and ETFs are, but also what we can expect from them and how they work.

So to start, let’s talk about stocks. This is something all of us have heard of it in the media and friends. We know of Apple, Google, and so on. But what is a stock? Well a stock is a certificate of ownership in a company. What does that mean? You actually own a piece of the company.  And the unit of stock is called a share. So if we’re saying we’re going to buy stocks, we’re actually buying shares in companies.  And if you own at least one share in a company, you are a shareholder. This makes you a part owner in the company.  Cool huh? So for $82 you can own a piece of Facebook. Zuckerberg status…. Well I mean 1 share means you own .000000036% of Facebook and Zuckerburg owns 20%, but screw it, we’re cooler.

So how did we figure out how much of Facebook you would own? Well each company out there breaks up their companies into shares. And as we mentioned, when you buy those shares, or stock, you own a piece of the company.  So each company has something called “outstanding shares.” These are the total number of shares that make up a company.  In Facebook’s example, they have approx. 2.8 billion outstanding shares. So if you bought all of those shares, you would own 100% of the company. Since we only bought 1 share of Facebook we divide 1 by 2.8 billion to get what percent of facebook that we own.

Since we’re on this topic, you have probably heard of companies like Facebook being two-hundred -billion dollar company. Have you ever wondered how they came up with that number? Well there is actually a mathematical and accounting reasoning behind it! You know how we discussed 2.8billion shares make up facebook? Well if we know how much each of those shares are worth, then we know how much the company is worth.  Because if we can buy all of those shares, then we can own 100% of the company!

And luckily we know what price the shares are trading it. If you look up the share price of Facebook using Tiingo or Yahoo, it will give you the last price Facebook was traded at. At the time of this podcast it was approximately $81. So if we take $81 dollars a share, and multiply it by the number of shares that exist, about  2.8 billion, we see it’s worth about $225 billion dollars.

Now there is one more super important topic we should talk about before we move away from companies. This is a concept called a Dividend. Now that you own a company, you may have more cash than you need. And sitting on all that cash can be unproductive, so wouldn’t you like to get paid for owning the company? After all, CEOs and management pay themselves salary, and you’re taking a risk too and own a piece of the company.  Wouldn’t it be nice to get an income too?

And so when you’re looking up a company, you may sometimes see something called a dividend. This is the cash you receive just for holding the company. Typically this is paid once a quarter, or once every three months. Now a dividend yield, is simply taking the total dividends paid in the last year and dividing it by the share price. So what you are measuring is, what percent are you being paid for holding that stock? The performance of stocks and other investments are measured by what percent return they give you. When you go to a bank, they tell you how much interest you’re being paid for holding money with them. Now right now, these days, a bank may give you 0.10% if you’re lucky. But if we look at Apple, we get paid 1.5%!

The reason is that stocks are higher risk than putting money in a bank. What if Apple drops 5%? Well, I’m guessing you wont care if Apple gives you 1.5% because you’re down 5%! Overall, you’re down 3.5%. But if it goes up 5%, you’re now up 6.5%.
So why do companies pay dividends and why should you care? The assumed investing knowledge says that if a stock goes up, and you get paid a dividend, it’s better for your portfolio because it helps stabilize things. Like if Apple goes down 5%, you’re actually only down 3.5% because of a dividend. And if it goes up 5% then you’re actually up 6.5% because of the dividend. And the reason companies pay it, is because they don’t really know what else to do with all the earnings they have.  It’s like when you get paid from your work. You put some away toward savings, retirement, mortgages, etc….but what do you do with the money you have left over? You enjoy it!

There are few more nuances with dividends will touch upon in a couple episodes from now, but let’s just take a moment and pause! It’s a lot of information at once.


3..2..1..
Okay enough pausing. I got bored.

So there are thousands and thousands of stocks out there, but how are they organized? Well each stock can be traded on something you’ve probably heard of called stock exchanges.  A couple examples are the New York Stock Exchange, NYSE, or Nasdaq. On these exchanges you can buy and sell stocks because shares are very standardized unified documents across each company. Share # 2,500 isn’t going to be different than share # 543,221. So to you, it doesn’t matter which share you have because, when it comes to owning a company, the shares for each company listed on an exchange are the same.  Trading stocks are what we call exchange-traded. They are uniform and traded on exchanges that anybody can access.

So we talked a lot about companies, what we can do to measure certain metrics, and how they are organized on exchanges. But what are things like the Dow, the S&P, and the Nasdaq Composite, which is different than the Nasdaq exchange. You may often hear things like the Dow was down 300 points today.

Well each of these is called a stock index, and together are stock indices. They are a measure of the stock market and can are used as measures of the health of economies. The DOW, the S&P, the Nasdaq composite are all comprised of a grab bag of companies  that try to measure the broad market or a market segment.  So if the S&P or DOW are said to be up or down 3%, it means the market is getting stronger or weaker.  They’re very important measures for policy makers, government agencies, corporations, and retirement and investment portfolios. So let’s touch upon the most commonly you hear about.

The first is called the DOW Jones Industrial average, or DOW for short. It’s made up of 30 very large stable companies that represent different sectors. For example, a few stocks in the DOW are Microsoft, Goldman Sachs, Coaca-Cola, Verizon, Pfizer,  and McDonalds.

Many of us have heard of the S&P, especially used by professionals. By why is that? Before we continue let’s just bring up a couple things that many people in the industry consider a major flaw with the Dow. The first is that it’s only 30 big companies, which doesn’t really represent the broad market. The second is that it is price-weighted.

In an index, each stock represents a portion of the index. When something is price-weighted, it means that the price determines how much of the index it makes up. For example, if the Dow was 10 stocks, and each stock was $10/share, they would all represent 10% of the Dow.

And here’s the odd part and the bigger reason why some people consider the DOW to be flawed. Remember how we discussed that Facebook was worth $225 billion? How we took the total number of shares available then multiplied it by how much each share was worth?

What if we took out the number of shares available and just considered $81.  Well guess what the price of Chipotle is right now, it’s $670/share. But if we take the number of shares available in Chipotle it’s only about 30 million. Remember facebook had 2.8bn shares. Okay to get the value of Chipotle, we take 30million shares and times it by the share price, we get that Chipotle is worth $20 billion dollars.

So chipotle is less than 10% the size of Facebook.  But, its share price is 8 times bigger than Facebook. So we can’t just look at the share price to see how big a company is. We have to consider how many shares exist. If Chipotle split itself into more and more pieces, and now had a billion shares outstanding, is it worth any less? No not at all. The share price will be lower, but it’s still worth the same.

But if we were using the Dow, Chipotle would have an 8 times as big impact in the DOW than would Facebook…even though it’s less than 1/10th of the size.  This is a big flaw.

But the S&P 500, uses the market cap, or size of the company to determine how much each stock comprises the index.  This is called value-weighted or capitalization-weighted. So in the S&P 500, Facebook is 10 times bigger than Chipotle, which makes more sense. IN addition, the S&P is made up of 500 stocks, not 30 so it represents a bigger market. This is why many professionals consider the S&P 500 a better measure of the market compared to the DOW.

The next index we often hear about is the NASDAQ. Remember how the NASDAQ was an exchange? The NASDAQ composite  is different, it’s an index that is made up of over 3,000 stocks that are traded on the NASDAQ exchange. Now this exchange was the first one that allowed online trading. Over time, many tech companies moved into the NASDAQ exchange, which means it tends to be tech heavy.  While all sorts of industries make up the NASDAQ,  many people associate it with more of a tech feel.

Now there is one more exchange I want to mention that doesn’t get brought up every so often. And that is the Russell 2000. It represents 2000 of the smaller companies. Whereas the S&P 500 represents large companies, typically called large capitalization companies, or “large-cap” the Russell 2000 represents small capitalization companies, or “small cap.” Remember that market capitalization referes to the size of the company. In FB’s case it was $225 billion and in Chipotle’s case it was $20bn. These would both be considered large-cap companies. The Russell 2000 gives a general indication of health for smaller companies.


So now that we’ve talked all about stocks, where they are traded, and how to measure the health of the economy, let’s move onto bonds.


Booooooonnnds

Sorry, I’m trying to add some excitement to bonds.

Ok! Onto bonds. So with stocks, when you own shares, you are investing in the company. When you buy bonds from a company, you are lending them money. You are a lendor. So if you own stock, youre an investor, and if you own a bond, you are a lender.  When you take out a mortgage or a loan, the bank is lendor. When you buy a bond, you are lending money to a company, the federal government, or a local government.

When you get a loan from a bank, you pay an interest rate. Likewise when you buy a bond, you get paid interest too.  SO a bond is broken up into the principal amount, the amount of money you lent the company or government, and the interest, what you make for lending out that money.  On top of this, like a mortgage or loan, the bond matures and the debt no longer exists once it reaches what we call “maturity.”  This is another key difference from stocks. Stocks do not have an end date, they exist as long as the company exists.

Let’s talk about bankruptcy. It’s not something we like to talk about, but let’s do it. If a company liquidates, you as a bondholder are first entitled toward the company’s assets to get back your loan. Only after bondholders are taken care of, do stockholders then get what’s left.  Because of this, bonds are generally considered safer investments than stocks.

A common concept, and generally, a higher risk investment should give you the opportunity for a higher reward. So if you are investing in a new company that just formed a week ago, you could probably assume it had a higher risk than let’s say McDonalds. So if McDonalds came up to you versus a new store that opened a week ago, who would you expect is a higher risk? Now people generally want to be paid for that risk, so if it’s higher risk you will ask for a higher interest rate. Whereas McDonalds may get a loan for 3.5%, you may charge the new store 6%.

Banks do the same thing with us when we go to them with a loan request. The difference is that we as individuals, each have a credit score. That credit score determines whether or not what we can get a loan and what risk the lender sees in us. If we are higher risk as determined by a low credit score, they will charge us a higher interest rate.  People who issue bonds have something similar called a “credit rating.” There are a few ratings agencies who are in the business of evaluating and scoring companies and governments to determine what their risk is.

The ratings are:

AAA – the highest rating
AA – second highest rating

A – third highest

And from BBB to B.

Typically below BB, it is considered a junk bond and that just means it’s a very high risk bond. Basically, there is a higher likelihood you may not get your money back if you lend to them. Junk bonds yield higher rates because of this risk.

I know a common question I had, was “well if a company like Ford goes bankrupt, there are assets you can take from them. What if a country goes bankrupt? Can you just take the country’s stuff? This is actually a really complicated topic, but it seems like a country defaulting on it’s bonds, doesn’t mean you can invade it. What it does mean, is that the country will have a much much harder time raising money next time around because they lost their reputation.  When you are buying bonds from a country, you are doing it on the, quote “full faith and credit” of that country.

This is why it’s a big deal if a country defaults.  Right now there is a big case going on between Argentina and a hedge fund. Argentina defaulted on its bonds for a second time since 2001 and the hedge fund refused to accept less money for the bonds than what it was owed. This led to a U.S. court saying Argentina couldn’t pay current bond holders until it paid the hedge fund first. The fund also tried to impound the country’s warships. This is turning into a messy case and many people have questioned the ethics of it all. Can certain countries hold other countries financially hostage? How does it affect the country trying to govern?

This is why so much money is poured into this  – so hopefully people can avoid these situations.

There are some other nuances about credit ratings, and a lot of these firms in charge or rating bonds came under flak in 2008. This is a more complex topic we will speak about in a future episode.

So now we have explained what a bond is, how they are generally priced, and how they are rated, let’s talk about how they are organized.

As an individual investor, you probably will not personally trade bonds. The reason is because there many many bonds out there, each with different characteristics. Additionally, they require a lot of money to purchase. Because of this, active trading in bonds is typically meant for people who do it professionally and have the backing of a lot of money and investors. Because of this, most bonds are traded directly between institutions like banks and mutual funds. This is done, in what is called the Over-the-counter market, or OTC market, not through an exchange. Whereas an exchange you can see everything that happens and what other people do, the OTC is not nearly as transparent. It’d be kind of like if you called a friend up and sold some of your furniture to him.  So typically when we trade bonds, we do so through mutual funds, index funds, and ETFs. If you don’t know what those are, that’s fine because we’re going to explore them in part 2 of this series.

I’m going to end this episode with a quick story: my second year on Wall street, I traded U.S. treasuries –basically bonds issued by the government. It was a really fun and exciting time. I remember my 2nd week on the job I got yelled at for fourteen straight hours once…yeahh haha. It was so fast paced that there were days I would forget to eat lunch. You would have to announce every time you had to go to the bathroom so somebody could take your spot.

I also had to pull an all-nighter trading on that desk when the U.S. presidential election happened.  See whereas stocks and bonds issued by companies are often moved by announcements by the companies, bonds issued by governments are often moved  by political events. The following year, I was trading bonds again globally at a hedge fund but we took a quantitative approach so it was a lot more relaxed. I got more sleep during those times and I didn’t have to announce when I had to use the bathroom….gooood times

We wont get too much into commodities here, just enough so you aren’t like me when I first started wondering how in the world people could measure the changes of the price of oil so quickly.

Did you know you can trade live cattle? There a ton of commodities you can trade. Typically we think of gold, silver, oil, maybe natural gas.  But you can also trade, cocoa, coffee, hogs, corn, and even orange juice. So these are traded on vehicles called futures. What these contracts are is that you enter an agreement to buy or sell the commodity at a future date. For example, you may buy  July 2015 crude oil futures, which mean in July 2015, you will actually buy 1,000 barrels of oil per contract you own. Where did I get the 1,000 number from? Well you know how we said shares between companies are the same which let us trade them on exchanges? The same is true for commodities. Each commodity has it’s own contract and the contract for WTI, a type of crude oil, specifies 1,000 barrels.

So if you see the price of oil  on TV, they are typically quoting the futures price. The price per barrel for 1,000 barrels. And because these contracts are exchange traded, it’s easy to see the price fluctuations for these commodities.

ANd finally, trading these commodities does offer benefits for people. Say you’re a corn farmer and you need to plan your expenses for the next year. Well, because the price of corn may fluctuate a lot, you may want to lock in a price so you can plan your budget. In order to do so, you may sell corn futures. This way, you know when the contract settles, you will be able to ship out your corn for the price you sold your contract for.

At the same time, if you just want to speculate on the price of corn, you don’t actually want to own it…or what we call “take delivery” you want to sell out of your corn. So if you forget to get rid of your corn contract before it expires, you may find yourself getting a call from somebody asking you where to ship the thousands of bushels of corn.


So with that, I hope you enjoyed part 1 of the amped up basics. If you have any feedback please E-mail me at [email protected]. In the next episode, we’re going to talk about commodities, mutual funds, index funds, etcs and so on.


Facebooktwitterredditpinterestlinkedinmail